Last week, the federal government released detailed data on 2018 open enrollment in private health insurance through the healthcare.gov Marketplace created by the Affordable Care Act (ACA). We dug into the data to see how enrollment shaped up in Tennessee’s Marketplace and to compare 2018 to prior years. For a review of county-level data, see this follow-up post.
Key Takeaways
- Enrollment in Tennessee’s Marketplace fell 2% in 2018 and appears to be leveling out — although federal policy changes may drive future enrollment lower.
- Average net monthly premiums fell about 50% in 2018 for subsidized enrollees in Tennessee but rose about 32% for enrollees without subsidies.
- The lowest-premium plans have become increasingly popular as premiums have risen, which has shifted more responsibility for out-of-pocket costs onto enrollees. This trend is even sharper among the 16% of enrollees without subsidies.
Figure 1
What We Learned About 2018 Obamacare Enrollment in Tennessee
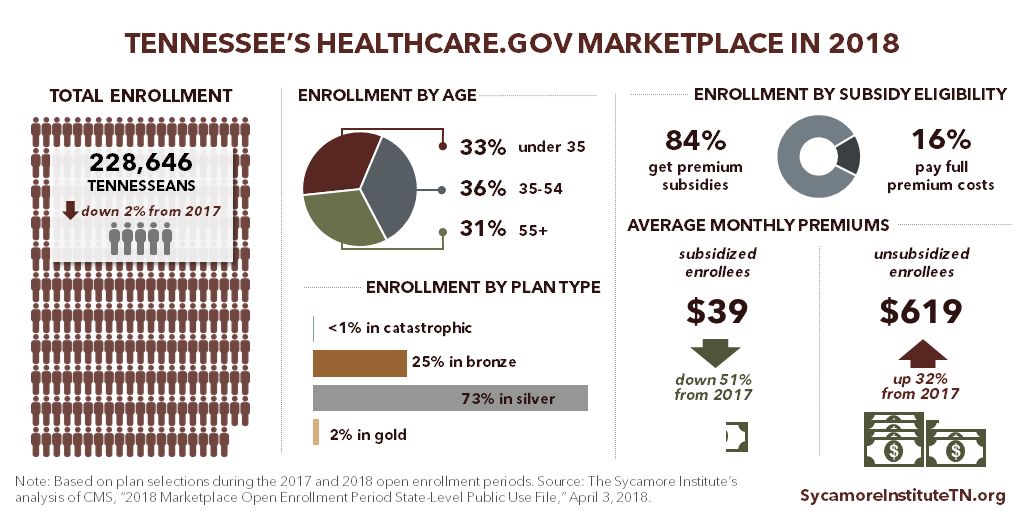
1. Enrollment in Tennessee’s ACA Marketplace was relatively stable with only a 2% drop from 2017.
(Figure 1) Compared with the 2017 open enrollment period, 2018 sign-ups were down about 2%, or 5,500 Tennesseans. (1) (2)
2. Average net monthly premiums fell about 50% in 2018 for subsidized enrollees but rose about 32% for enrollees without subsidies.
(Figure 1) About 84% of enrollees are eligible for federal subsidies to offset premium costs, which are available to those with incomes under 400% of poverty (about $48,560 for an individual in 2018). These enrollees’ average net premiums are $39 per month — about $40 less (or 51%) than in 2017. (1) (2) For the 16% of enrollees not eligible for subsidies, average premiums are about $619 per month — about $151 more (or 32%) than in 2017. (3)
When the Trump administration stopped making cost-sharing reduction (CSR) payments to insurers in 2017, many predicted that premiums would rapidly increase in 2018. In fact, premiums did rise sharply for plans tied to the CSR program. These higher premiums triggered larger federal subsidies, which allowed many subsidized enrollees to pay less in 2018 than in 2017.
3. The least expensive plans are the most popular. (2)
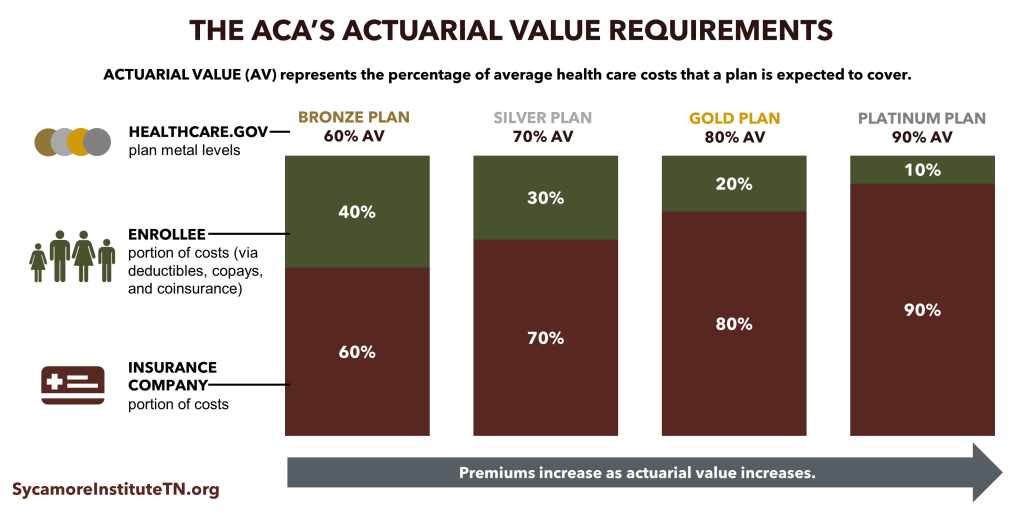
Nearly all sign-ups were for bronze or silver plans. Plans’ “metal levels” indicate their actuarial values — the share of average health care costs that plans are expected to cover. (Figure 2) Compared to gold and platinum plans, bronze and silver plans cover fewer out-of-pocket costs and tend to have lower premiums.
4. About a third of enrollees are under the age of 35. (2)
(Figure 1) The proportion of Tennessee enrollees under 35 has remained relatively stable since 2014. (4) (5) (6) (1) This is one indicator of the breadth and stability of Marketplace insurers’ risk pools — an important factor in how premiums change. Enrollees’ health status, insurer and enrollee incentives, and the stability of the regulatory environment also affect premiums.
Figure 2
3 Trends That Put 2018 Obamacare Enrollment in Context
Looking at the broader context for Tennessee’s ACA Marketplace since it launched in 2014, we see 3 trends affecting enrollment and premiums.
1. Enrollment appears to be leveling off, although recent federal policy changes may drive it lower.
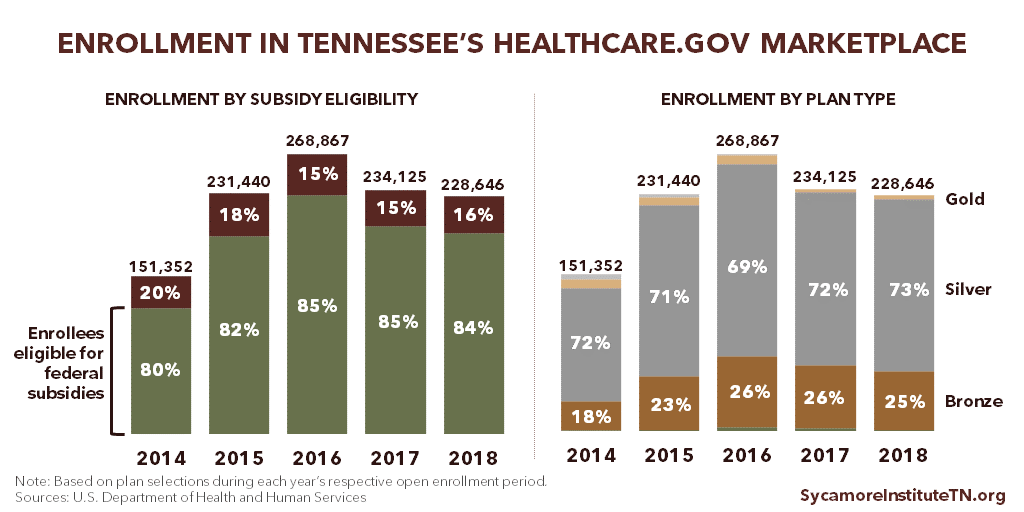
After peaking in 2016 at about 269,000 people, sign-ups in Tennessee fell in 2017 to 234,000 and were relatively stable into 2018 with a small drop to about 229,000. (Figure 3) (4) (7) (6) (1) (2) After open enrollment closed, however, Congress repealed the penalty on individuals who do not sign up for health insurance coverage. In addition, the Trump administration has issued rules intended to increase the availability of plans that cost less but have fewer benefits than those available in the Marketplace. As a result, some Tennesseans who might otherwise enroll in the Marketplace may instead choose to go uninsured or get their coverage outside the Marketplace.
Figure 3
2. Federal subsidies have insulated most enrollees from the lion’s share of premium increases.
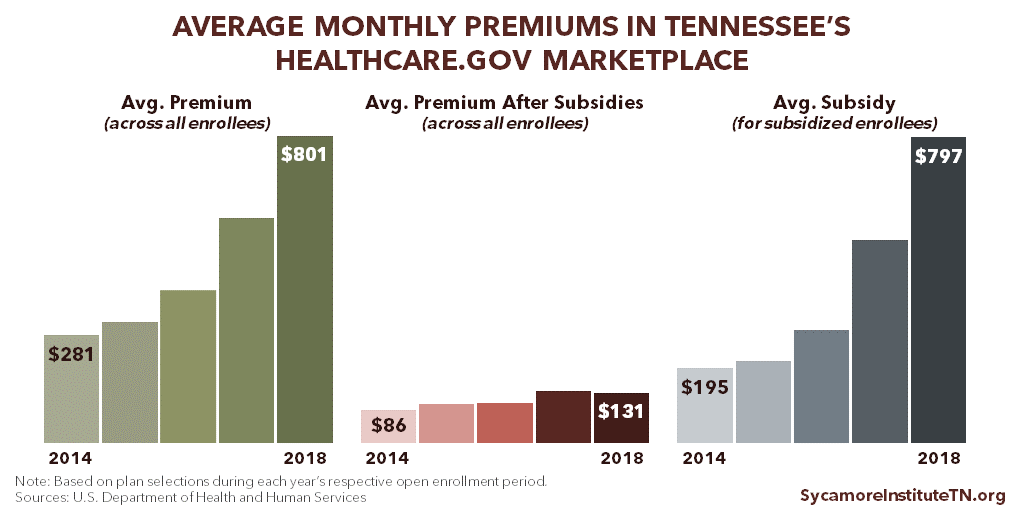
The average monthly premium (before subsidies) for all Tennessee Marketplace enrollees has grown from $281 in 2014 to $801 in 2018, a 185% increase. (Figure 4) After accounting for subsidies, the average out-of-pocket premium across all enrollees grew about 52%, from $86 in 2014 to $131 in 2018. (8) (7) (9) (1) (2) Due to the dramatic difference in premiums paid by subsidized and unsubsidized enrollees, these averages do not necessarily reflect the typical enrollee’s experience. However, data that allow for comparisons between subsidized and unsubsidized enrollees are only available for 2017 and 2018 (see point 2 in the previous section).
Average subsidies have increased faster than average premiums — by 309% between 2014 and 2018. (8) (7) (9) (1) (2) Federal premium subsidies limit the cost of premiums based on income and are available to Marketplace enrollees with household incomes between 100-400% of poverty. For example, in 2018, Marketplace premiums are capped at 2.01% of household income for individuals with incomes between 100-133% of poverty. (10) This structure ties the value of subsidies to the cost of premiums.
Figure 4
3. The lowest-premium plans have become increasingly popular as premiums have risen, which has shifted more responsibility for out-of-pocket costs onto enrollees.
In 2014, 9% of all sign-ups in Tennessee were in gold and platinum plans, which charge higher premiums in exchange for lower out-of-pocket costs. In 2018, the share of gold and platinum plans fell to 2%. Meanwhile, Tennesseans’ selection of bronze plans grew from 18% of all sign-ups in 2014 to 25% in 2018. (4) (5) (6) (2) (Figure 3) This shift has made the rise in average premium less severe but also puts enrollees on the hook for higher average copays, deductibles, and other out-of-pocket costs.
The trend toward plans with lower premiums is even sharper among the 15-16% of enrollees not eligible for subsidized premiums. The share of enrollees who are ineligible for subsidies has stayed relatively flat over the last three years, but their choice of plans has changed significantly. In 2018, 63% of unsubsidized enrollees signed up for bronze plans versus 45% in 2017 and 42% in 2016. (6) (1) (2)
What’s Next?
Marketplace insurers must submit their proposed 2019 premiums by July 25, 2018. Plans and rates will be finalized by late September ahead of the 2019 open enrollment period, which runs from November 1 to December 15, 2018. (11) Changes to the regulatory environment between now and then could affect 2019 Marketplace offerings, premiums, and enrollment.
Congress does not currently appear poised to further change the rules for individual market coverage this year. Last year, Congress shelved several proposals to partially repeal and replace the ACA (e.g. the American Health Care Act and the Graham-Cassidy proposal). Efforts this year to tweak the existing structure (e.g. Senator Alexander’s proposal to fund CSR payments and a reinsurance program) have so far not been successful.
Several changes made since 2018 plans were finalized could impact 2019 and beyond:
- In December 2017, Congress repealed the penalty for the individual mandate as part of tax reform legislation.
- In January 2018, the Trump administration proposed new rules that may increase the availability of non-ACA compliant plans with lower-costs and smaller-benefits than plans in the Marketplace. These rules are expected to be finalized in the coming months.
- In rules finalized on April 9, 2018, the Trump administration offers states more options in choosing the “benchmark” plan for 2020, which defines the set of benefits that Marketplace plans must cover.(1) It also scales back requirements related to the navigator program, which provides enrollment assistance for the Marketplace. (1)
There are trade-offs to these changes, which provide individuals more alternatives to the Marketplace. Young and healthy people who would otherwise get coverage via the Marketplace may choose to go uninsured or opt for lower-cost, smaller-benefit plans that don’t meet ACA requirements. As a result, premiums would likely rise even higher for those remaining in the Marketplace, who would tend to be older and less healthy. Exactly how these trade-offs might be felt across Tennessee will depend on a number of factors — including demographics and health status.
References
Click to Open/Close
- Centers for Medicare and Medicaid Services. 2017 Marketplace Open Enrollment Period State-Level Public Use File. U.S. Department of Health and Human Services. [Online] May 11, 2017. [Accessed on April 4, 2018.] Accessed via https://www.cms.gov/Research-Statistics-Data-and-Systems/Statistics-Trends-and-Reports/Marketplace-Products/Plan_Selection_ZIP.html.
- —. 2018 Marketplace Open Enrollment Period State-Level Public Use File. U.S. Department of Health and Human Services. [Online] April 3, 2018. [Accessed on April 4, 2018.] Accessed via https://www.cms.gov/Research-Statistics-Data-and-Systems/Statistics-Trends-and-Reports/Marketplace-Products/2018_Open_Enrollment.html.
- Pellegrin, Mandy. The Sycamore Institute’s analysis of CMS’ 2017 and 2018 Marketplace Open Enrollment Period State-Level Public Use File. 2018.
- Office of the Assistant Secretary for Planning and Evaluation. Profile of Affordable Care Act Coverage Expansion Enrollment for Medicaid/CHIP and the Health Insurance Marketplace: Tennessee. U.S. Department of Health and Human Services. [Online] May 1, 2014. https://aspe.hhs.gov/system/files/pdf/93796/tn.pdf.
- Centers for Medicare and Medicaid Services. 2015 Marketplace Open Enrollment Period County-Level Public Use File. U.S. Department of Health and Human Services. [Online] April 20, 2017. [Accessed on April 4, 2018.] Accessed via https://www.cms.gov/Research-Statistics-Data-and-Systems/Statistics-Trends-and-Reports/Marketplace-Products/2015_Open_Enrollment.html.
- Office of the Assistant Secretary for Planning and Evaluation. Health Insurance Marketplaces 2016 Open Enrollment Period: Final Enrollment Report – State-Level Data Excel Tables. U.S. Department of Health and Human Services. [Online] March 11, 2016. Accessed via https://aspe.hhs.gov/health-insurance-marketplaces-2016-open-enrollment-period-final-enrollment-report.
- —. Health Insurance Marketplaces 2015 Open Enrollment Period: March Enrollment Report. U.S. Department of Health and Human Services. [Online] March 10, 2015. https://aspe.hhs.gov/system/files/pdf/83656/ib_2015mar_enrollment.pdf.
- Burke, Amy, Misra, Arpit and Sheingold, Steven. Premium Affordability, Competition, and Choice in the Health Insurance Marketplace, 2014. U.S. Department of Health and Humans Services, Office of the Assistant Secretary for Planning and Evaluation. [Online] June 18, 2014. https://aspe.hhs.gov/system/files/pdf/76896/2014MktPlacePremBrf.pdf.
- Office of the Assistant Secretary for Planning and Evaluation. Health Insurance Marketplaces 2016 Open Enrollment Period: Final Enrollment Report. U.S. Department of Health and Human Services. [Online] March 11, 2016. https://aspe.hhs.gov/system/files/pdf/187866/Finalenrollment2016.pdf.
- Kaiser Family Foundation. Explaining Health Care Reform: Questions About Health Insurance Subsidies. [Online] November 8, 2017. https://www.kff.org/health-reform/issue-brief/explaining-health-care-reform-questions-about-health/.
- Centers for Medicare and Medicaid Services. Key Dates for Calendar Year 2018: QHP Certification in the Federally-facilitated Exchanges; Rate Review and Risk Adjustment. U.S. Department of Health and Human Services. [Online] April 9, 2018. https://www.cms.gov/CCIIO/Resources/Regulations-and-Guidance/Downloads/Key-Dates-Table-for-CY2018.pdf.
- Keith, Katie. Unpacking The Final 2019 Payment Notice (Part 1). Health Affairs. [Online] April 10, 2018. https://www.healthaffairs.org/do/10.1377/hblog20180410.631773/full/.


