

Key Takeaways
- Tennessee’s 95 counties continued to experience significant differences in income levels, poverty rates, educational attainment, and health insurance status in 2019-2023.
- On average, Middle Tennesseans had the highest education and income levels and the lowest poverty and uninsured rates.
- Tennessee’s urban counties had higher educational attainment, higher incomes, less poverty, and lower uninsured rates relative to the state’s rural counties.
- The poverty rate in most Tennessee counties exceeded the U.S. rate, and the child poverty rate in many counties was higher than their overall poverty rate.
The latest U.S. Census Bureau data for Tennessee’s 95 counties show significant income, poverty, health insurance coverage, and educational attainment differences. Middle Tennesseans generally had the lowest poverty rates, highest median household incomes, and highest levels of education compared to West and East Tennesseans. Meanwhile, Tennesseans living in rural counties were more likely to be uninsured than those in urban counties.
Note
The numbers analyzed here are based on five years of data (2019-2023) rather than single-year estimates. The Census Bureau uses these to produce more reliable forecasts for less-populated counties and recommends not comparing five-year estimates with overlapping years. See the final section of this policy brief for more details.
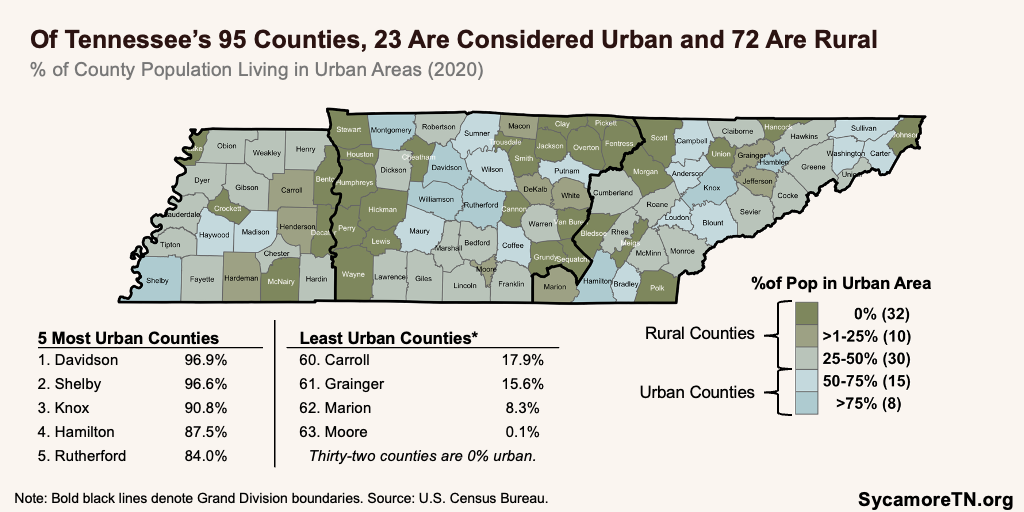
Urban and rural counties are defined using the following definitions from the 2020 Census (Figure 1):
- Urban Counties — 23 counties in which 50% or more of the population lives in an area designated as urban.
- Rural Counties — 72 counties in which less than half of the population lives in urban areas—including 32 entirely rural counties. (1)
Figure 1
Income and Poverty
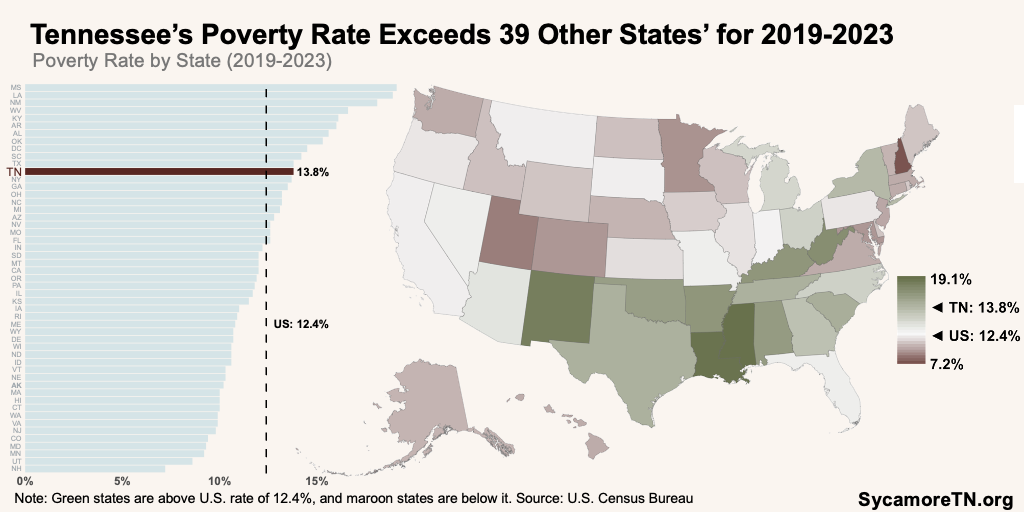
From 2019–2023, Tennessee had a lower median household income and a higher poverty rate than most of the country (Figures 2 and 3). At $67,097, the state had the 10th lowest median household income. Tennessee’s poverty rate was 13.8%—the 12th highest rate and nearly double the lowest rate of 7.2% in New Hampshire.
Figure 2
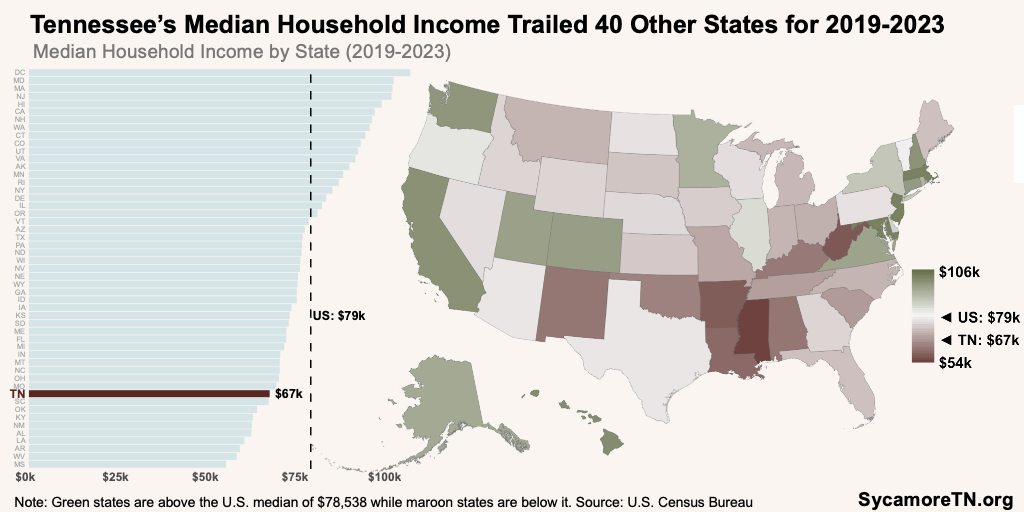
Figure 3
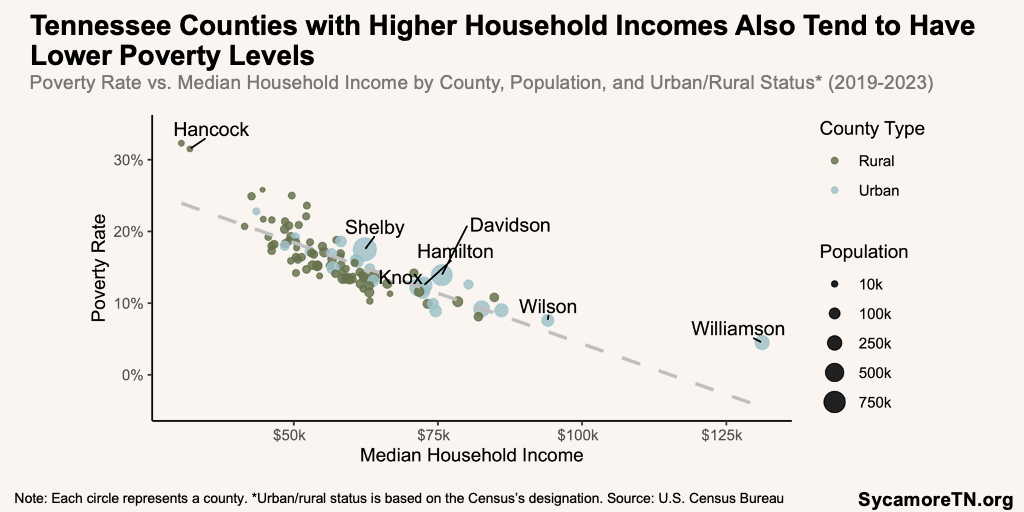
Within Tennessee, county-level income and poverty rates varied widely (Figures 4 and 5). High-income counties typically had lower poverty rates than low-income counties (Figure 6). For example, Williamson County led the state with a median household income of $131,202—over four times the lowest level in Lake County, at $30,500. Similarly, the poverty rate was the lowest in Williamson at 4.5%—over seven times lower than the highest level in Lake County, at 32.3%.
Figure 4
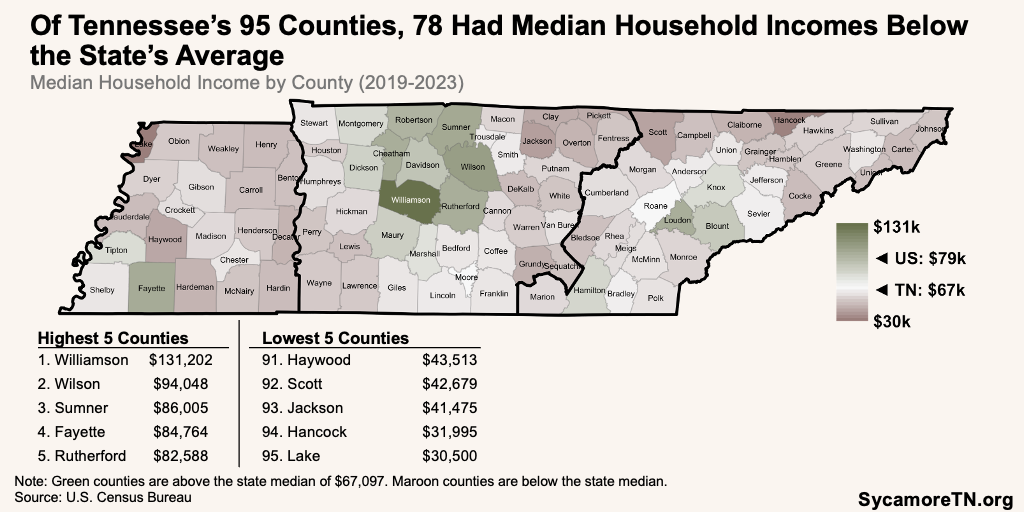
Figure 5
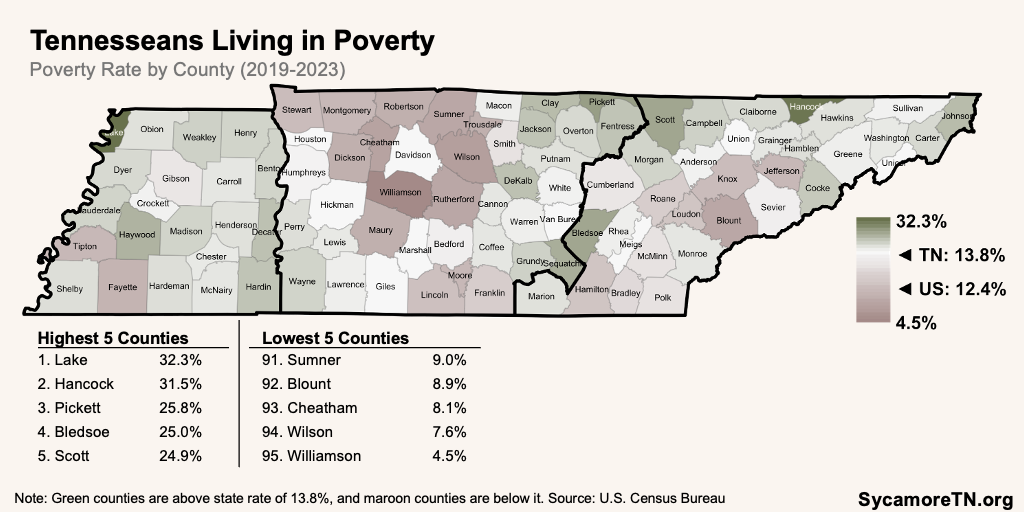
Figure 6
Other key findings include:
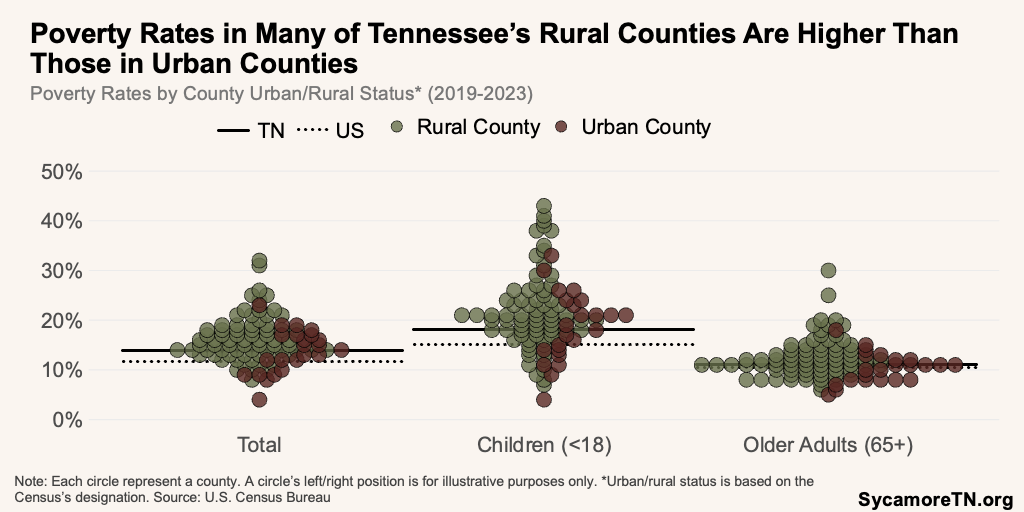
- Rural vs. Urban — Tennesseans living in rural counties had higher poverty rates and lower incomes than urban counties (Figures 7 and 8). In rural counties, 16.5% of residents were in poverty—compared to 13.9% in urban counties. (3) The median household income for each of Tennessee’s 72 rural counties was $55,869, on average—compared to $68,778 for the state’s 23 urban counties. (2)
Figure 7
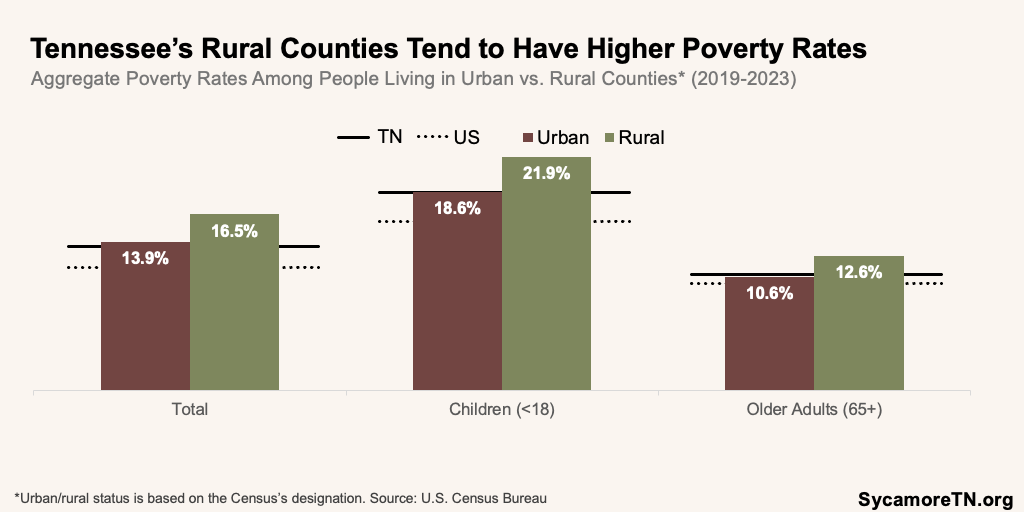
Figure 8
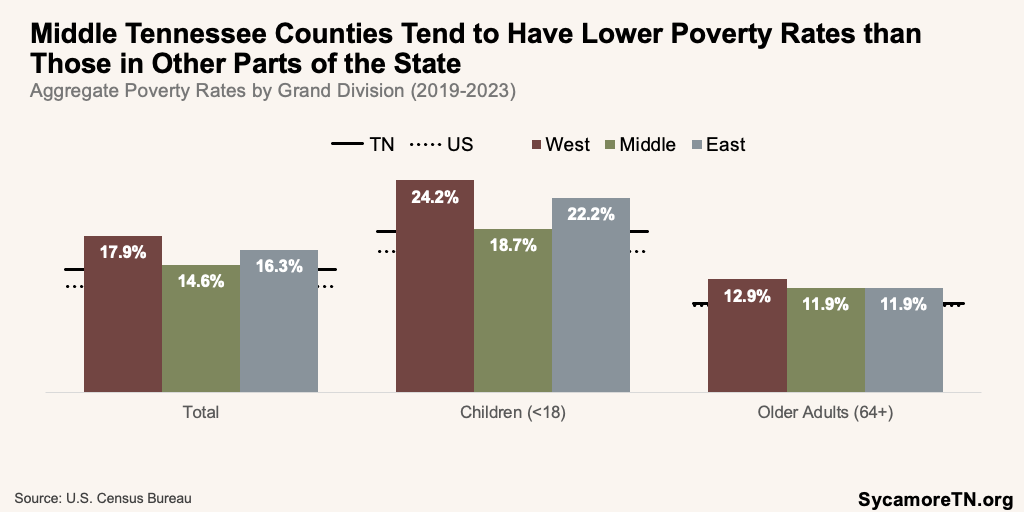
- Grand Division — Residents of Middle Tennessee counties had lower poverty rates and higher incomes than Tennesseans in the state’s other two regions (Figure 9). The poverty rate in West Tennessee (17.9%) exceeded that of East (16.3%) and Middle Tennessee (14.6%). (3) The average of counties’ median household incomes varied significantly by Grand Division—$53,880 for the 21 West Tennessee counties, $57,577 for the 33 East Tennessee counties, and $62,754 for the 41 Middle Tennessee counties. (2)
Figure 9
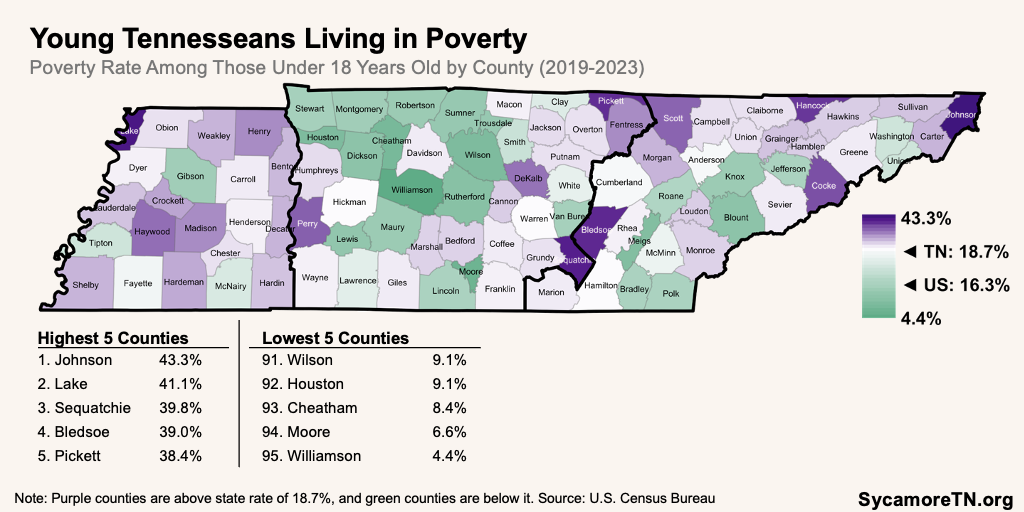
- Child Poverty — Child poverty rates were higher than overall poverty rates in 91 of Tennessee’s 95 counties (Figure 10). In Johnson County, more than four out of every nine children, or 43.3%, lived in poverty. In Williamson County, the figure was much lower, with fewer than five out of every 100 children living in poverty, or 4.4% of children. (3)
Figure 10
- Older Adults — Poverty rates among older adults 65+ were generally lower than those for other populations but varied significantly by county (Figure 11). In Hancock County, almost one-third of older adults lived in poverty, or 30.4%. Little more than one in 20 older adults in Williamson County did, or 5.1%.
Figure 11

A Word About the Official Poverty Measure
The official poverty measure (OPM) is a widely used—but imperfect—measure of whether individuals and families have the resources to meet basic needs. For example, many agree it is outdated and fails to capture differences in cost of living. However, it remains more commonly used than existing alternatives. For example, the supplemental poverty measure (SPM) takes into account a broader set of resources, but it’s not routinely reported in a way that allows for meaningful analysis at the state- or county-level. Meanwhile, other initiatives like United Way’s ALICE research calculates alternative thresholds based on local costs for things like housing, child care, food, and transportation. However, these data are only available for several years and not offered for comparison across all states.
Levels of Education
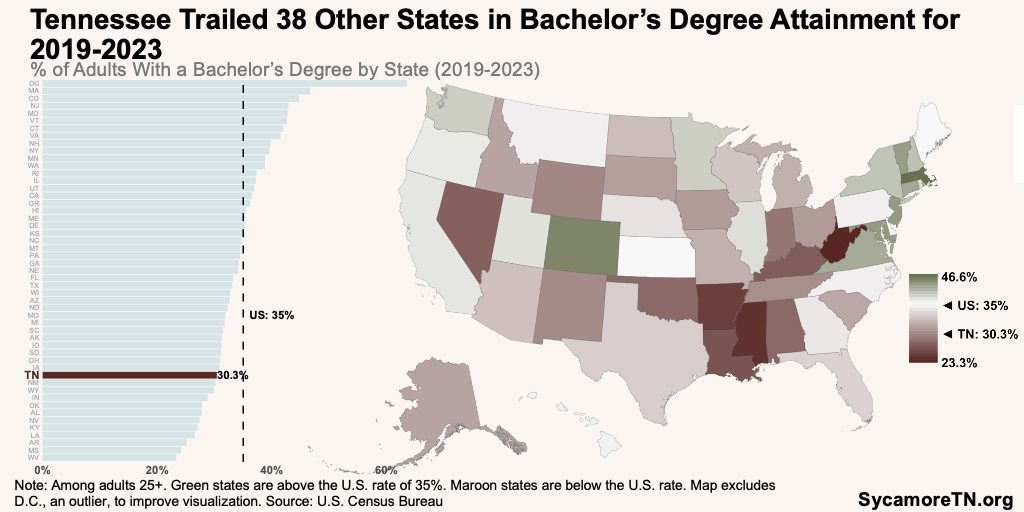
From 2019 to 2023, Tennessee ranked behind most states in post-secondary educational attainment (Figure 12). The share of those ages 25+ with at least a bachelor’s degree was 30.3%—behind 38 other states and D.C. The share of Tennessee adults ages 25+ with at least an associate’s degree was 38.2%—lower than 40 other states and D.C. (4)
Figure 12
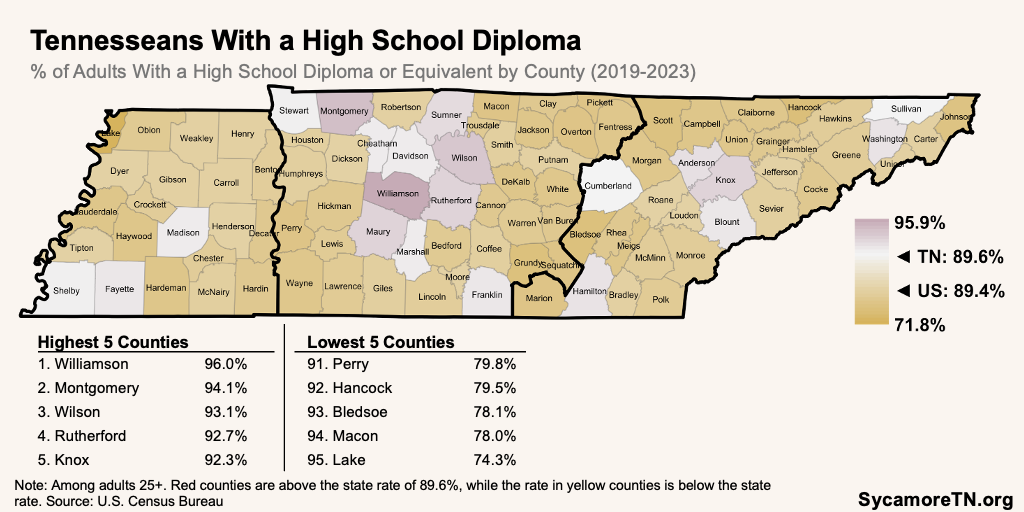
Within Tennessee, levels of adult educational attainment varied significantly by county (Figures 13–15). For example, Williamson County led the state with 61.8% of residents aged 25+ holding at least a bachelor’s degree—over seven times the Hancock County rate of 8.6%. (4)
Figure 13
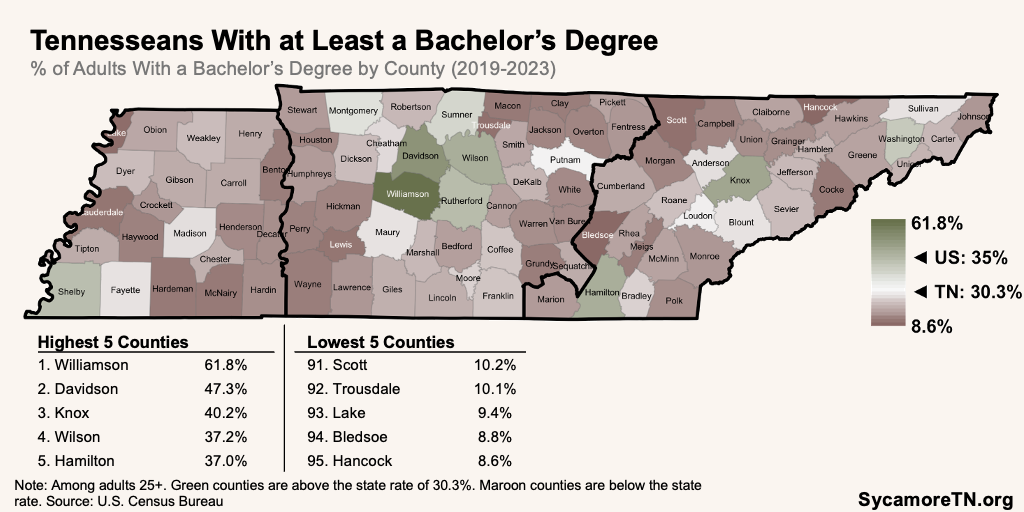
Figure 14
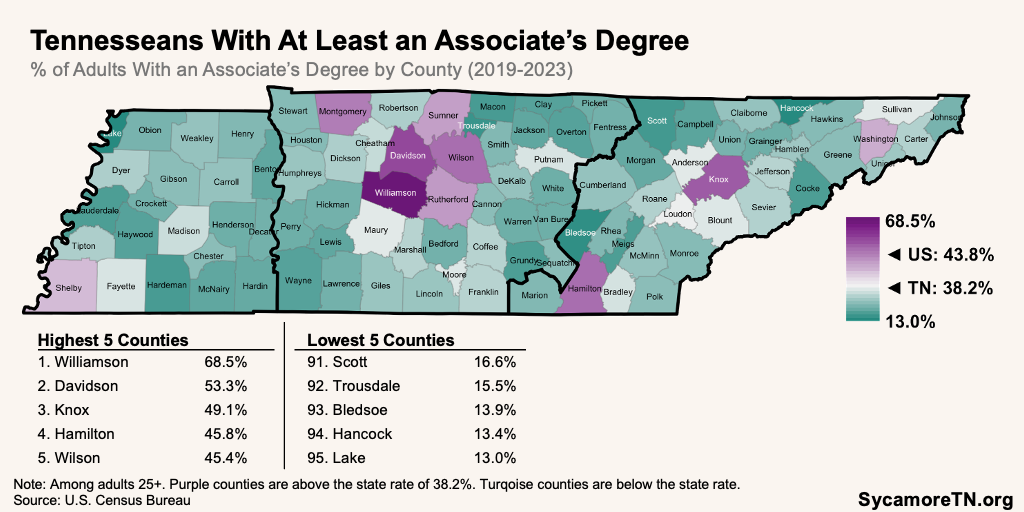
Figure 15
Other key findings include:
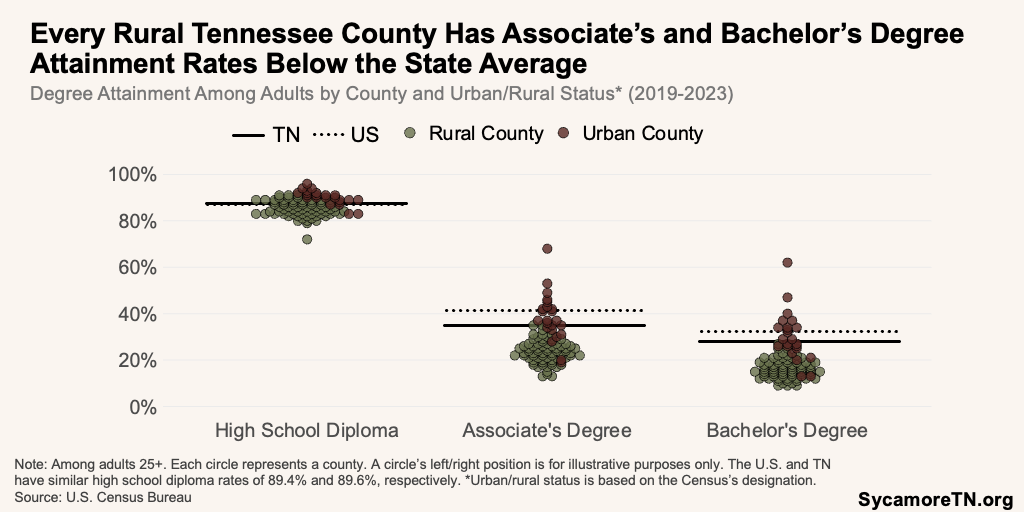
- Rural vs. Urban — Educational attainment rates were higher among adults in Tennessee’s urban counties (Figures 16 and 17). For example, 91.1% of adults in urban counties held a high school diploma, 44.1% had at least an associate’s degree, and 36.2% had a bachelor’s degree. The high school, associate’s, and bachelor’s degree rates in rural areas were 86.4%, 25.2%, and 17.6%, respectively. (4)
Figure 16
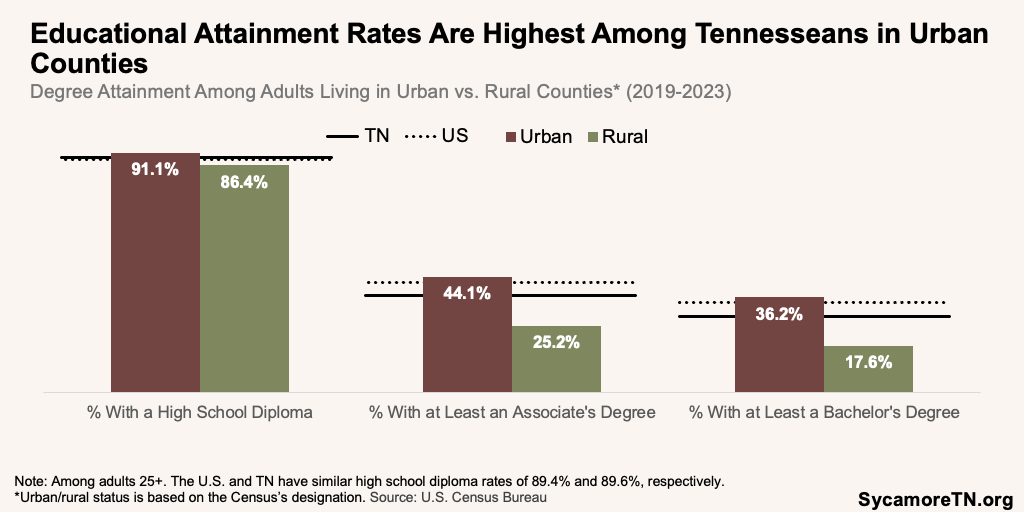
Figure 17
- Grand Division — Middle Tennesseans had higher educational attainment than the other two regions in 2019-2023 (Figure 18). For example, 34.5% of adults 25+ in Middle Tennessee had at least a bachelor’s degree, compared to 27.8% in West Tennessee and 27.4% in East Tennessee. (4)
Figure 18

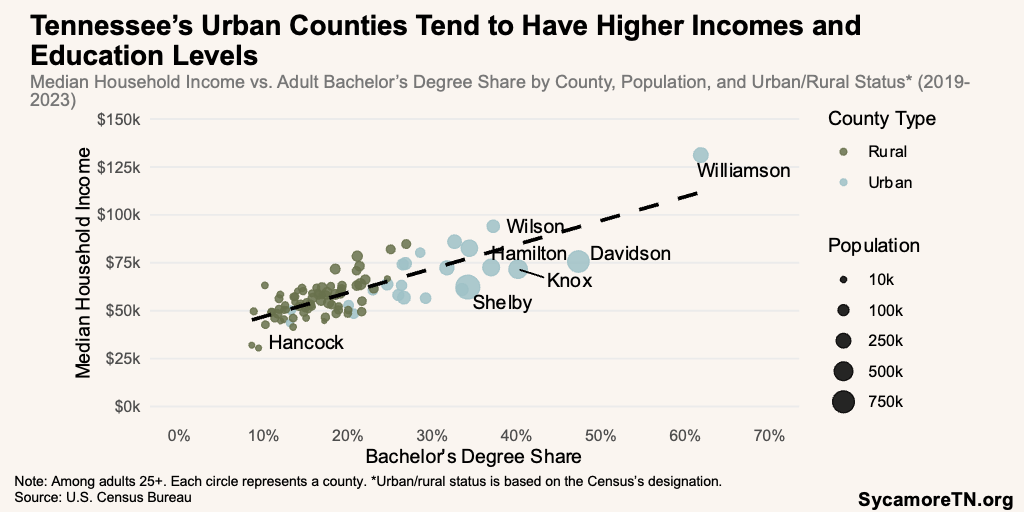
- Education and Income — Counties with higher levels of educational attainment tended to have higher household median incomes and tended to be urban (Figure 19). (4)
Figure 19
Health Insurance Coverage
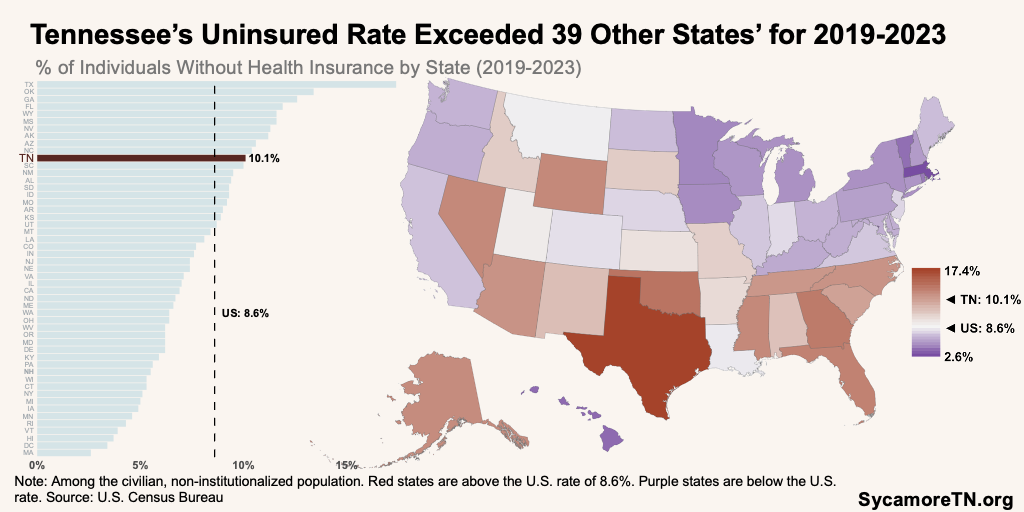
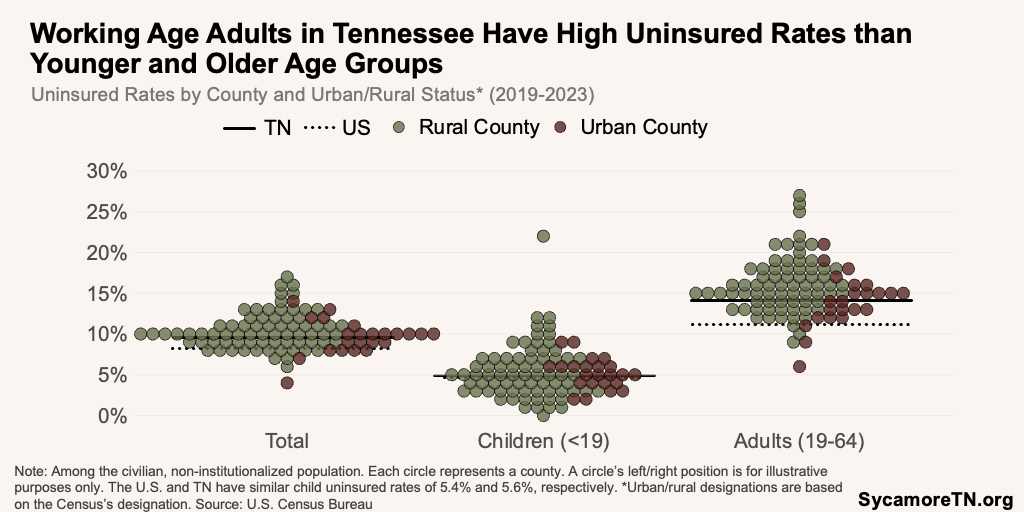
In 2019-2023, Tennessee had a higher share of individuals without health insurance than most of the country (Figure 20). The state’s 10.1% uninsured rate exceeded the national rate of 8.6% and was higher than in 39 other states and D.C. The uninsured rate among those ages 19-64 was 14.6%, which drove Tennessee’s high overall uninsured rate. State uninsured rates were considerably lower among those under 19 (5.6%) and those ages 65+ (0.6%). (5)
Figure 20
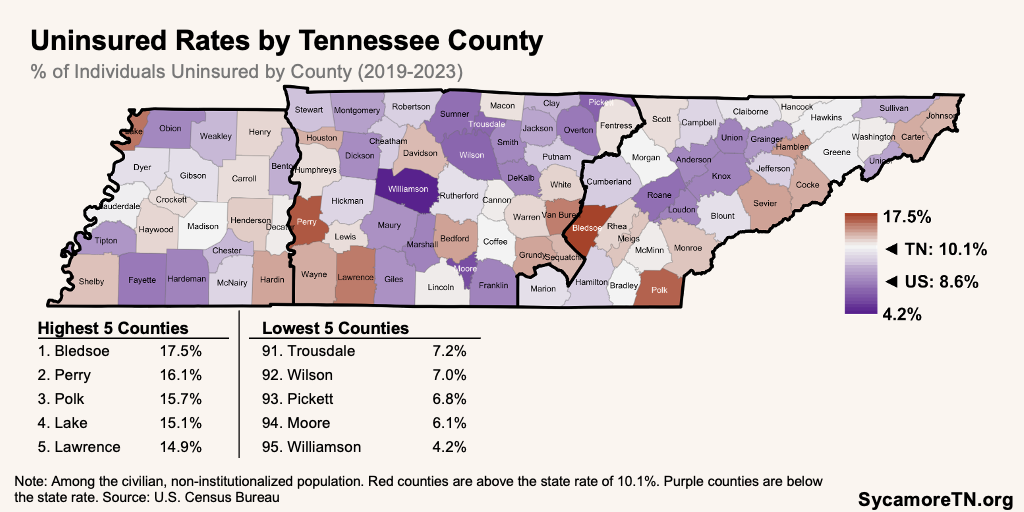
Within Tennessee, 76 counties have an uninsured rate that exceeds the national rate, and significant gaps exist between the most and least insured counties (Figure 21). For example, at 4.2%, Williamson County had the lowest uninsured rate, over four times lower than Bledsoe County, the highest at 17.5%. (5)
Figure 21
Other key findings include:
- Rural vs. Urban — The uninsured rate was higher in rural counties (10.6%) than in urban counties (9.9%) in 2019-2023 (Figures 22 and 23). (5)
Figure 22
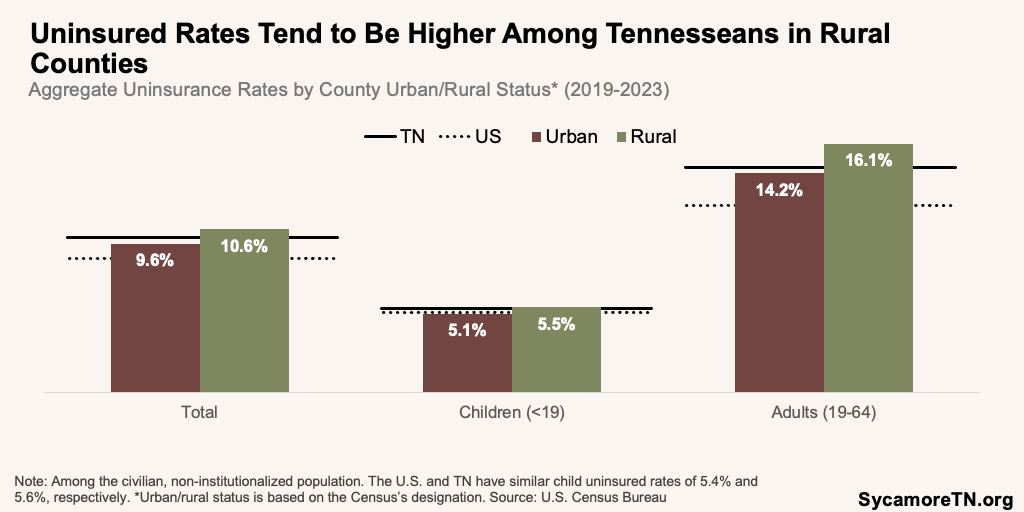
Figure 23
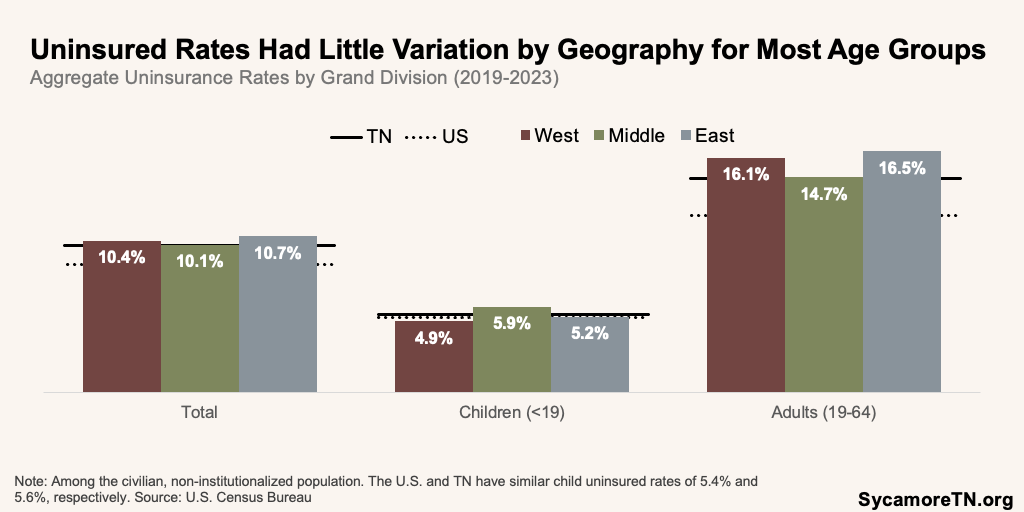
- Grand Division — Across Tennessee’s three Grand Divisions, West Tennesseans’ uninsured rate was highest (Figure 24). In 2019-2023, 10.4% of West Tennesseans lacked health insurance—compared to 10.1% of Middle Tennesseans and 10.7% of East Tennesseans. (5)
Figure 24
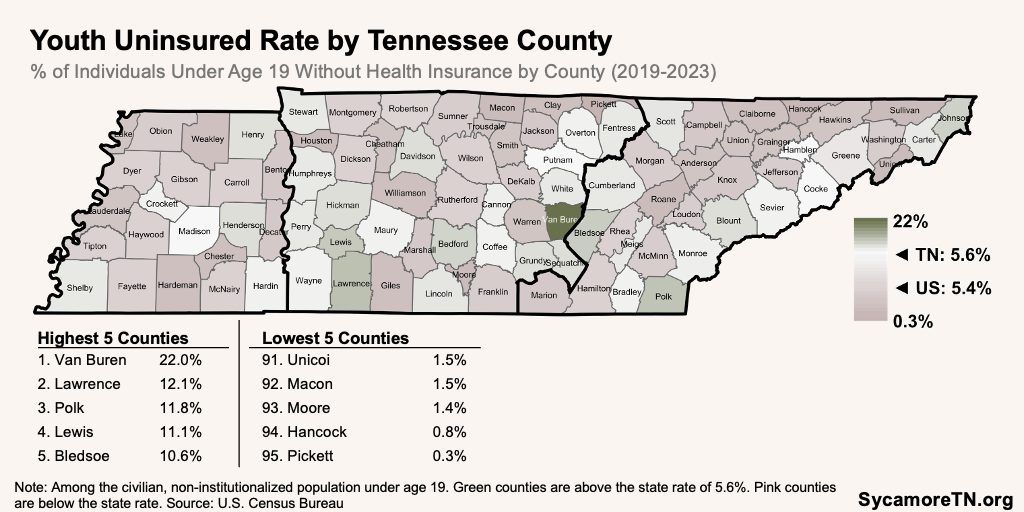
- Children — The uninsured rate among youth under 19 years old ranged from 0.3% in Pickett County to 22% in Van Buren County (Figure 25).(5)
Figure 25
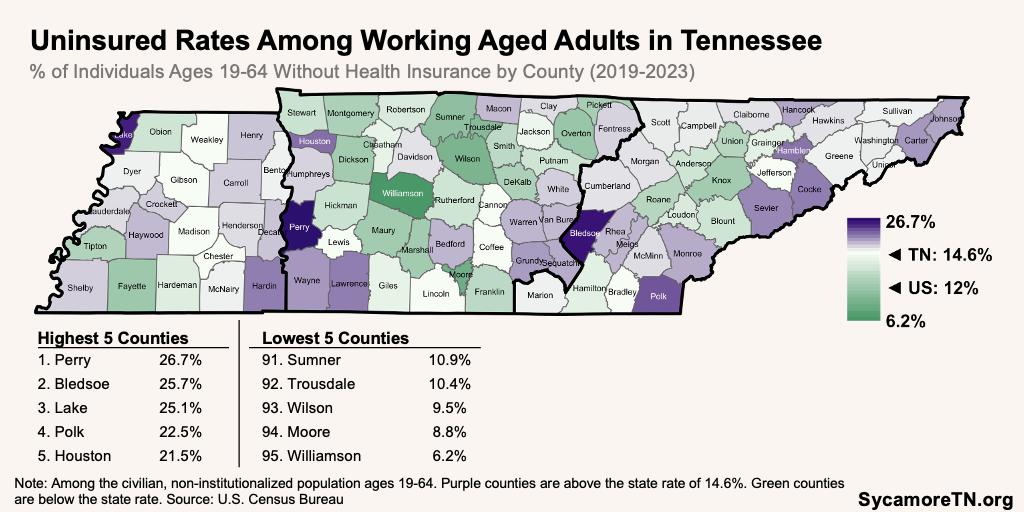
- Working-Age Adults — Statewide, the uninsured rate was highest among those aged 19-64 at 14.6% (Figure 26). (5) Coverage rates for adults in this age group varied widely by county. In Williamson County, the uninsured rate was 6.2%, over four times lower than in Lake (25.1%), Bledsoe (25.7%), and Perry (26.7%) Counties. (5)
Figure 26
About the Data
The five-year estimates presented here are based on the U.S. Census Bureau’s American Community Survey for 2019-2023, the most current data available. There is a one-year lag between when data collection stops and when the Census Bureau publishes them. While many metrics often represent a single year, the Census Bureau does not publish one-year estimates for areas with small populations, including many Tennessee counties. Instead, they combine data across several years to reduce sampling error and produce more accurate estimates. Even with multiple years of data, however, the estimates for less populous counties generally have wider margins of error than counties with larger populations.
References
Click to Open/Close
References
- U.S. Census Bureau. Urban and Rural: County-level 2020 Census Urban and Rural Information for the U.S., Puerto Rico, and Island Areas. [Online] September 2023. [Accessed on December 12, 2024.] https://www.census.gov/programs-surveys/geography/guidance/geo-areas/urban-rural.html.
- —. “Median Income in the Past 12 Months (in 2022 Inflation-Adjusted Dollars).” American Community Survey, ACS 5-Year Estimates Subject Tables, Table S1903. [Online] 2023. [Accessed on December 12, 2024.] https://data.census.gov/table/ACSST5Y2023.S1903?q=S1903&g=040XX00US47.
- —. “Poverty Status in the Past 12 Months.” American Community Survey, ACS 5-Year Estimates Subject Tables, Table S1701. [Online] 2023. [Accessed on December 12, 2024.] https://data.census.gov/table/ACSST5Y2023.S1701?q=S1701&g=040XX00US47.
- —. “Educational Attainment.” American Community Survey, ACS 5-Year Estimates Subject Tables, Table S1501. Explore Census Data. [Online] 2023. [Accessed on December 12, 2024.] https://data.census.gov/table/ACSST5Y2023.S1501?g=040XX00US47.
- —. “Selected Characteristics of Health Insurance Coverage in the United States.” American Community Survey, ACS 5-Year Estimates Subject Tables, Table S2701. Explore Census Data. [Online] 2023. [Accessed on December 12, 2024.] https://data.census.gov/table/ACSST5Y2023.S2701?q=S2701&g=040XX00US47.
- —. “Health Insurance Coverage Status by Ratio of Income to Poverty Level in the Past 12 Months by Age.” American Community Survey, ACS 5-Year Estimates Detailed Tables, Table C27016. [Online] 2023. [Accessed on December 12, 2024.] https://data.census.gov/table/ACSDT5Y2023.C27016?q=C27016&g=010XX00US_040XX00US47,47$0500000&moe=false.
