The latest U.S. Census Bureau data for all 95 of Tennessee’s counties continue to show large differences between counties in household income, poverty rates, education levels, and health insurance coverage.
To explore the data for specific counties, use the interactive map and tool at the bottom of this post. In earlier reports we used similar data to produce 2019 estimates of income and poverty, education, and health insurance coverage for the state as a whole and the 20 most populous Tennessee counties.
Note: The numbers analyzed here are based on five years of data rather than single-year estimates. The Census Bureau uses these to produce more reliable estimates for rural, less populated counties. See the final section of this policy brief for more details.
Key Takeaways
- On average, Tennessee’s more densely populated counties and those in Middle Tennessee continue to have higher incomes, less poverty, and more education.
- A majority of counties saw an increase in household wealth, a decrease in poverty, and an increase in education levels from prior years.
- While the vast majority of counties saw decreases in their overall uninsured rates from prior years, the uninsured rate among children grew in over half of Tennessee counties.
Figure 1

Income and Poverty
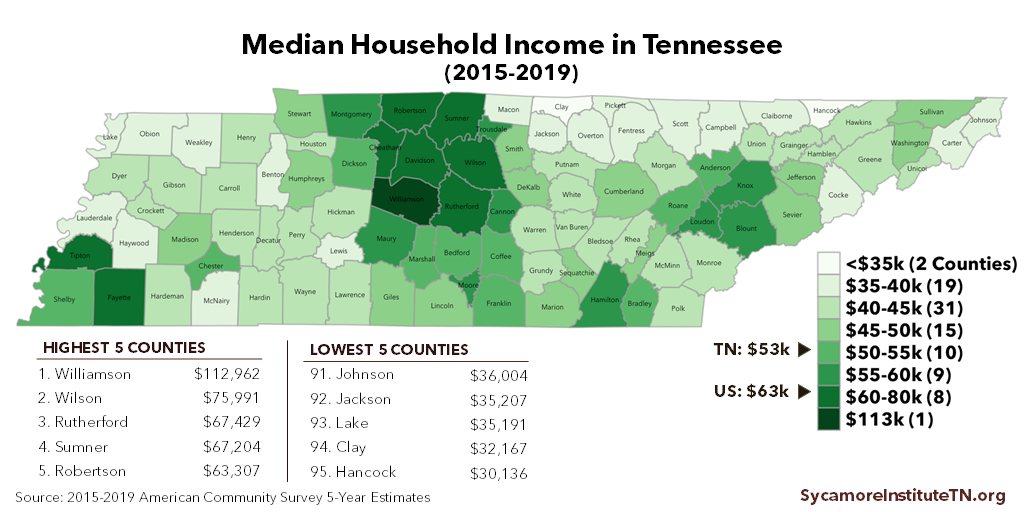
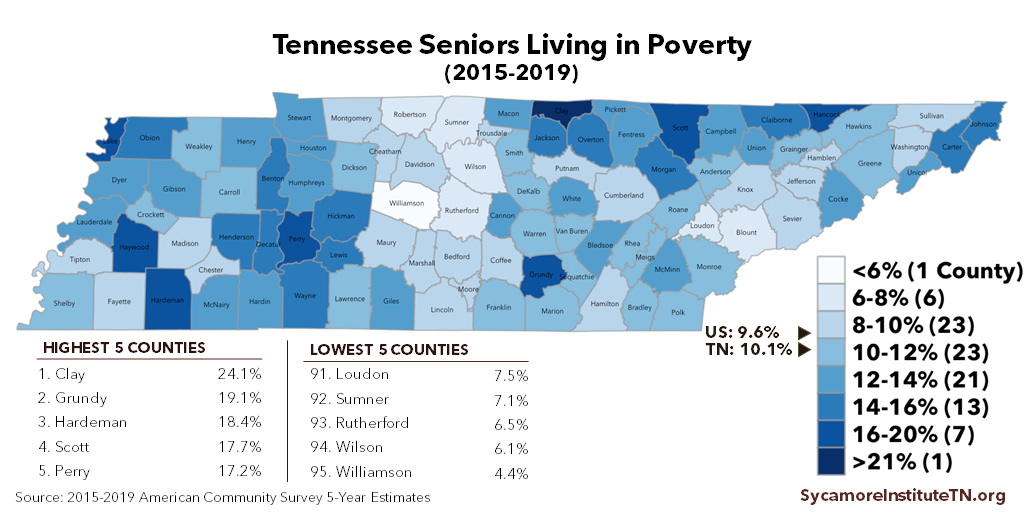
Income and poverty vary significantly across the state. For example, the median household income (where half of all incomes are higher and half are lower) was as high as $113,000 in Williamson County and as low as $30,000 in Hancock County (Figure 1). Counties that had high poverty rates tended to have significantly lower median household incomes (Figures 2, 3, 4). While every county has its own unique circumstances, here are some notable trends.
- Suburban Middle Tennessee Counties: Residents in many of the suburban counties surrounding Nashville have the state’s highest incomes and lowest poverty rates — including Williamson, Wilson, Sumner, and Rutherford Counties.
- Rural Counties: Residents in the state’s rural, less densely-populated counties tend to have lower incomes than state and national averages. Overall poverty rates as well as those for children and the elderly also exceeded state and national averages in rural counties. This continues a trend from prior years.
- Urban Counties: Compared to Tennessee’s 10 least densely-populated counties, residents in the state’s 10 most densely-populated counties tended to have higher median household incomes ($60,000 vs. $40,000) and lower overall poverty rates (14% vs. 20%), child poverty (19% vs. 28%), and poverty among the elderly (9% vs. 15%).
Both household income and poverty rates improved in the majority of counties compared to previous estimates. After adjusting for inflation, the median household income rose in 83 counties while overall poverty rates fell in 74 counties. The median household income in Perry County, for example, increased by nearly $6,000 from previous years’ estimates. In Trousdale County, the overall poverty rate shrunk by over 5 percentage points, and its child poverty rate dropped by 8 percentage points.
Figure 2

Figure 3

Figure 4

Level of Education
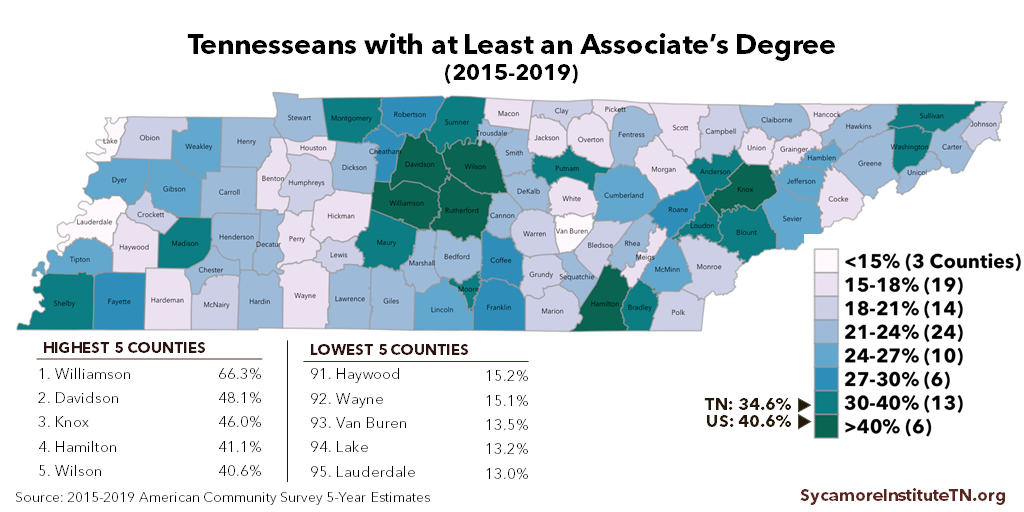
Tennessee counties also varied widely in terms of the education levels of their residents. For example, about 66% of adults aged 25 and older in Williamson County had at least an associate’s degree compared with just 13% in Lauderdale County (Figure 5). Almost 60% of Williamson County residents had at least a bachelor’s degree compared with about 8% in Van Buren County (Figure 6).
Education levels were significantly higher in Tennessee’s most densely populated counties. In the state’s 10 most densely populated counties, about 34% had a bachelor’s degree or higher and just over 41% had at least a 2-year degree. In the 10 least densely populated Tennessee counties, just 12% had a bachelor’s degree or more and 18% had at least a 2-year degree.
Most counties saw growth in their residents’ education levels compared to previous estimates, but there were modest declines in about a third of Tennessee counties. The share of residents ages 25+ with at least an associate’s degree fell in 25 counties from the previous 5-year estimates. Meanwhile, the share of those with a bachelor’s degree dropped in 28. However, no county declined by more than 2 percentage points for associate’s degrees or 3 percentage points for bachelor’s degrees or higher.
Figure 5

Figure 6

Uninsured Rates
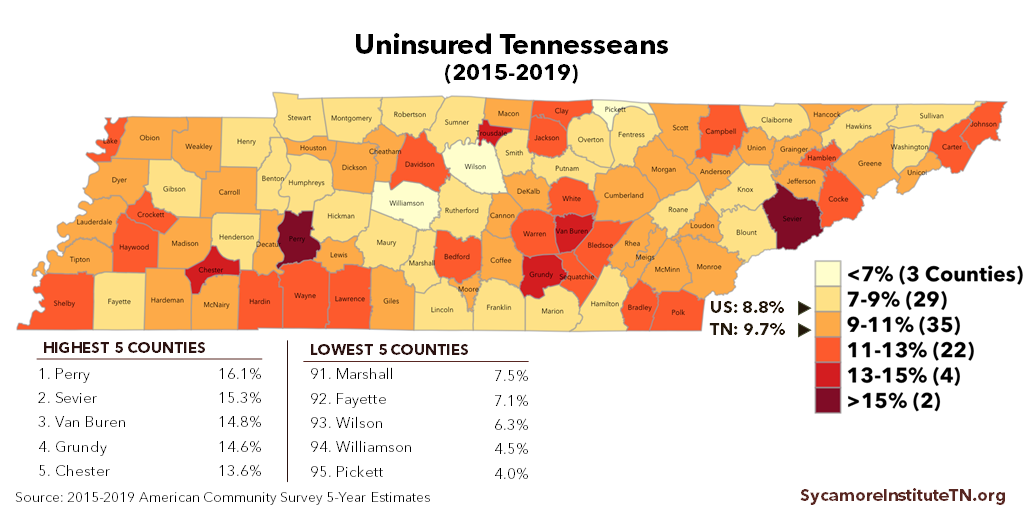
Some counties had significantly higher overall uninsured rates than statewide averages. For example, about 1 in 6 people in Perry and Sevier Counties did not have some form of health insurance coverage — compared with the statewide rate of just under 1 in 10 (Figure 7). Meanwhile, 15.7% of children in Perry County were uninsured — more than three times the statewide rate of 4.5% (Figure 8).
While the overall uninsured rate declined from prior years in the majority of Tennessee counties, it grew among child populations. The overall uninsured rate grew in in just 29 of Tennessee’s 95 counties, and in no county did it grow by more than 1.5 percentage points. However, 47 counties saw their uninsured rates rise among residents aged 18 or below. The largest increase occurred in Van Buren County, where the uninsured rate among children rose from about 2% to 6% between the 2015-2019 and 2014-2018 estimates.
Figure 7

Figure 8

About the Data
The five-year estimates shown here are based on data from the U.S. Census Bureau’s American Community Survey collected from 2015-2019. They are the most current available as there is about a one year lag between when data collection stops and when they are released by the Census Bureau for researchers to use. While many metrics are often discussed in the context of a single year, the Census Bureau does not publish one-year estimates for areas with small populations, which excludes many Tennessee counties. (5) Instead, they pool data across several years in order to minimize sampling error and produce more accurate measures. These multi-year estimates are more reliable than one-year estimates for areas with smaller populations and provide comparable data for all counties in Tennessee. Even with multiple years of data, however, the estimates for less populous counties generally have wider margins of error.
References
Click to Open/Close
- U.S. Census Bureau. Median Household Income in the Past 12 Months (In 2019 Inflation-Adjusted Dollars). 2015-2019 American Community Survey 5-Year Estimates. [Online] December 10, 2020. https://data.census.gov/cedsci/table?q=B19013&g=0400000US47.050000&tid=ACSDT5Y2019.B19013&hidePreview=true.
- —. Poverty Status in the Past 12 Months by Age. 2015-2019 American Community Survey 5-Year Estimates. [Online] December 10, 2020. https://data.census.gov/cedsci/table?q=B17020&g=0400000US47.050000&tid=ACSDT5Y2019.B17020&hidePreview=true.
- —. Educational Attainment for the Population 25 Years and Older. 2015-2019 American Community Survey 5-Year Estimates. [Online] December 10, 2020. https://data.census.gov/cedsci/table?q=B15003&g=0400000US47.050000&tid=ACSDT5Y2019.B15003&hidePreview=true.
- —. Types of Health Insurance Coverage by Age. 2015-2019 American Community Survey 5-Year Estimates. [Online] December 10, 2020. https://data.census.gov/cedsci/table?q=B27010&g=0400000US47.050000&tid=ACSDT5Y2019.B27010&hidePreview=true.
- —. When to Use 1-Year, 3-Year, or 5-Year Estimates. [Online] September 10, 2020. https://www.census.gov/programs-surveys/acs/guidance/estimates.html.
