Key Takeaways
- Between 2022 and 2023, Tennessee’s uninsured rate remained the same overall and across most demographic and socioeconomic characteristics.
- Many of Tennessee’s most populated counties saw increases in their uninsured rates.
- Men, Hispanics, younger adults, the unemployed, and people with less education and income remain the most likely to be uninsured in Tennessee.
The U.S. Census Bureau released new data in September 2024 on income, poverty, education, and health insurance coverage in 2023. These metrics paint a picture of the social and economic circumstances across America. Here’s what stands out from Tennessee’s 2023 health insurance coverage estimates.[1]
Background
In 2023, 91% of Tennesseans had health insurance—more than half of them through an employer (Figure 1). (1) Compared to 2022, the number of Tennesseans with each type of coverage remained relatively stable (Figure 2)—although the share on Medicaid, known as TennCare in Tennessee, increased slightly. Different age groups also relied on each source of coverage to varying degrees (Figure 3).
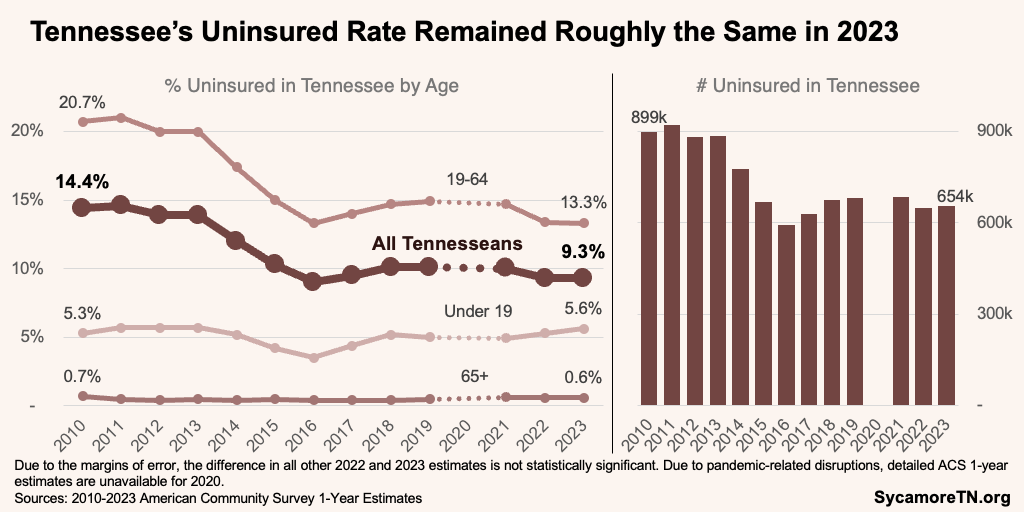
Tennessee’s uninsured rate remained at 9.3%—the same as in 2022 (Figure 4). (1) Around 654,000 Tennesseans were uninsured in 2023—an increase from 2022 that was within the margin of error and not considered statistically significant.
Figure 1
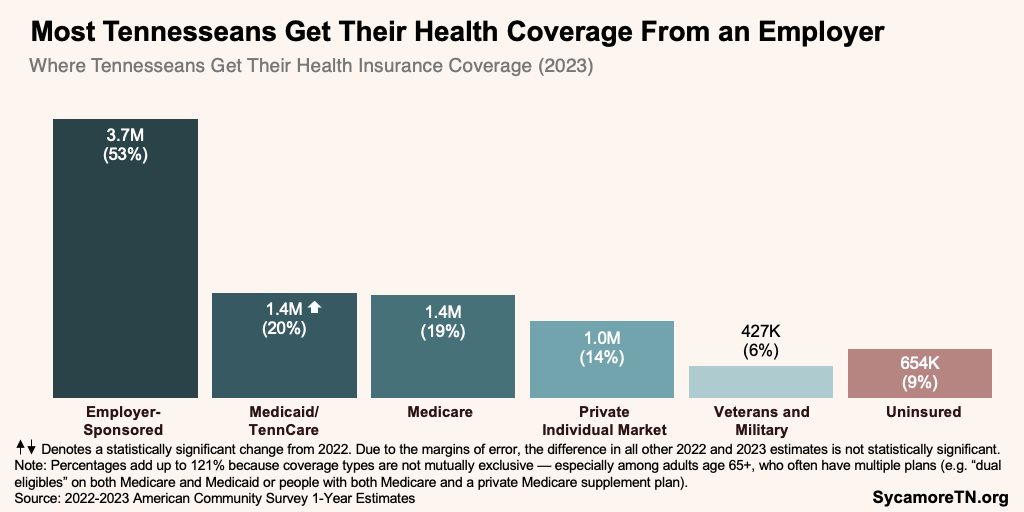
Figure 2
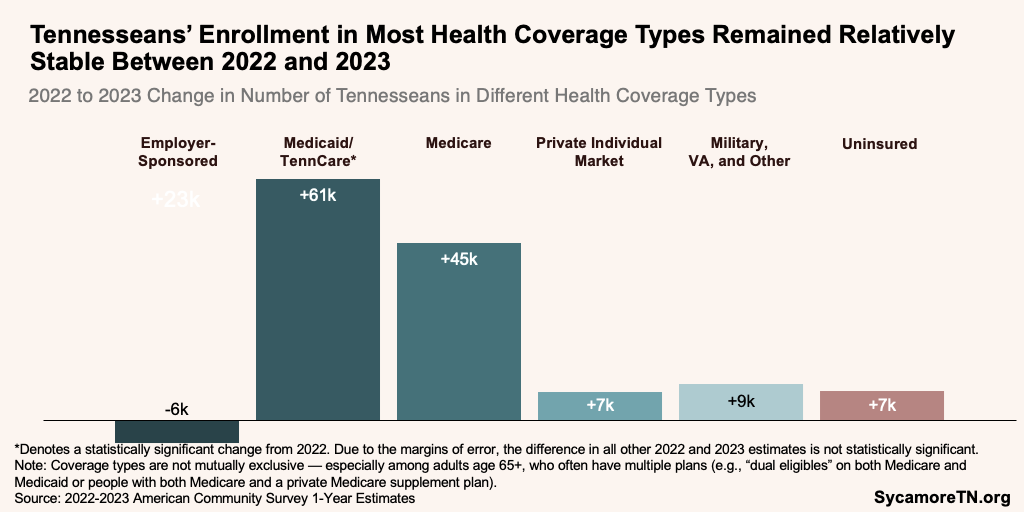
Figure 3
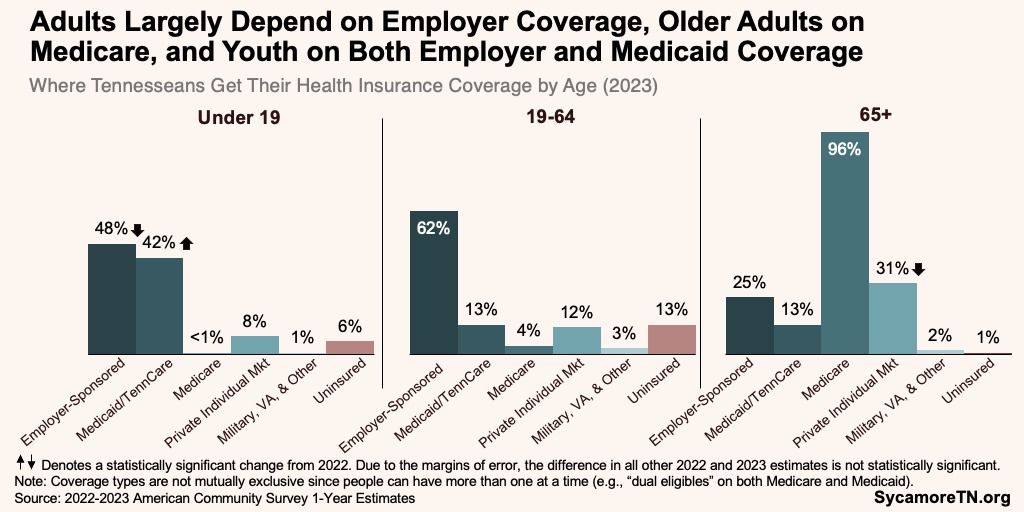
Figure 4
Demographic Variation
Men, Hispanics, and younger adults are still more likely to be uninsured, although the uninsured rate declined slightly for Hispanic Tennesseans (Figures 5 and 6). (1) The uninsured rate remained unchanged for many demographic and socioeconomic groups between 2022 and 2023. However, uninsured rates among Hispanics and pre-retirement seniors saw slight decreases.
Differences in the uninsured rate by race and ethnicity continue to narrow (Figure 7). (1) In 2023, the uninsured rate was 2.6 percentage points higher among black Tennesseans than white residents—compared to 4.1 points in 2010. The Hispanic uninsured rate was 21.8 points higher than that of white Tennesseans—versus 28.3 in 2010.
Figure 5
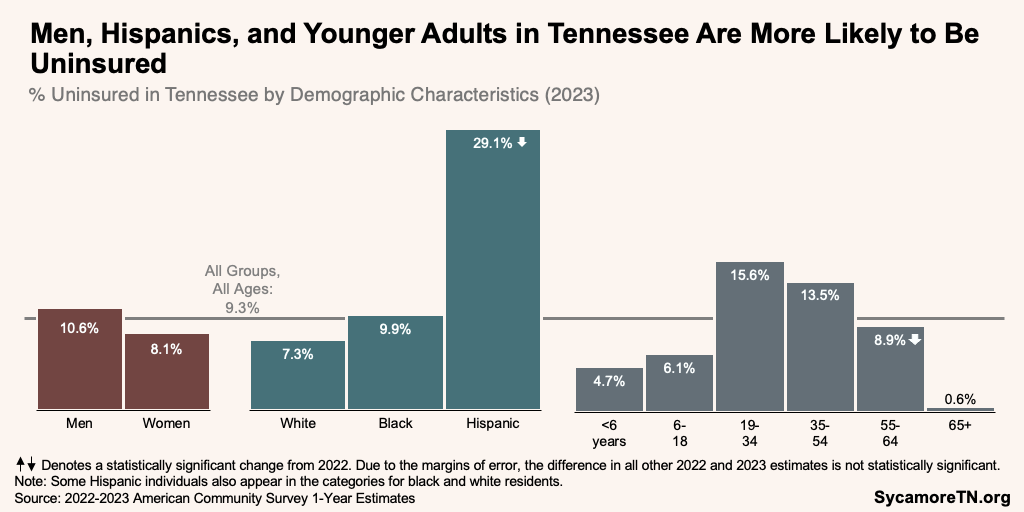
Figure 6
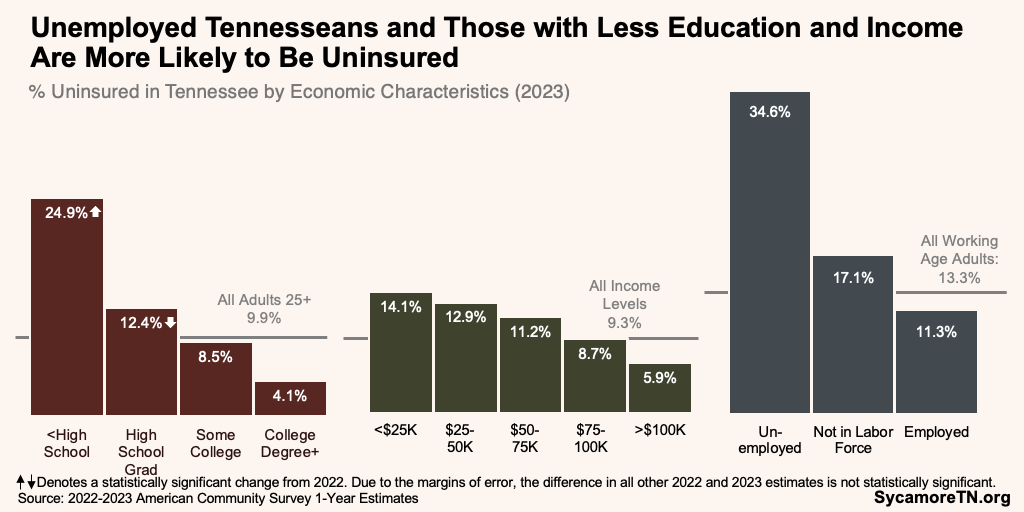
Figure 7
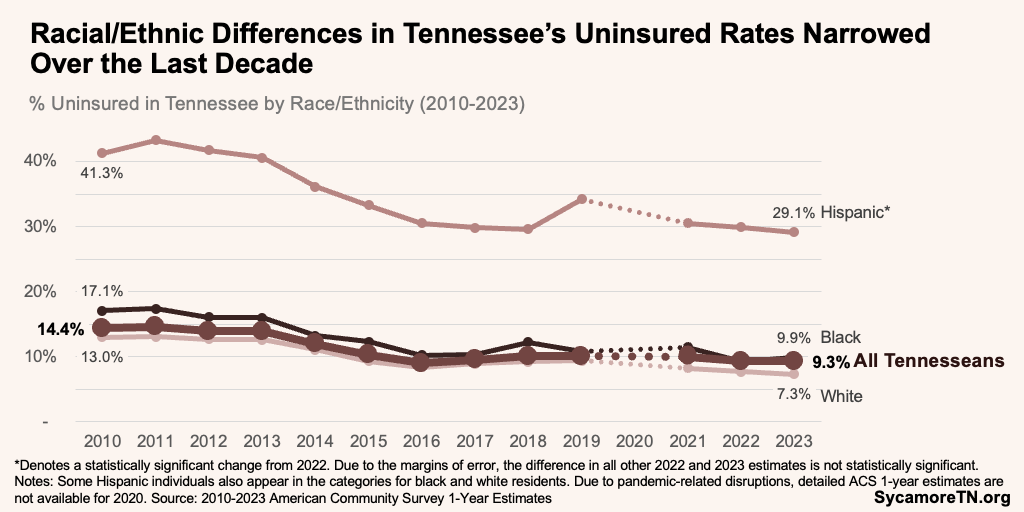
Figure 8
Geographic Variation
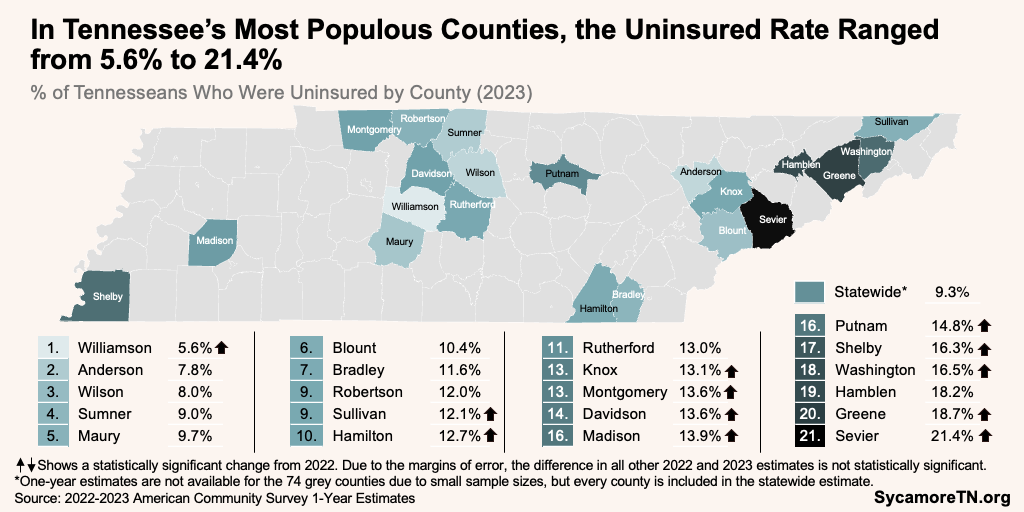
Uninsured rates increased in many of the most populated counties of Tennessee. (1) The Census Bureau’s September data release includes 2023 estimates for counties with populations above 65,000. Among the 21 Tennessee counties with available data, the uninsured rate ranged from 5.6% in Williamson County to 21.4% in Sevier County (Figure 8). Over half of the counties saw a statistically significant increase in their uninsured rate, while the statewide rate remained the same. The uninsured rate was below the statewide rate of 9.3% in only four of the 21 most populated counties—Williamson, Anderson, Wilson, and Sumner. See Table A1 in the Appendix for additional county data.
References
Click to Open/Close
References
- U.S. Census Bureau. 2010-2022 American Community Survey 1-Year Estimates. [Online] September 2023. Available via https://data.census.gov/. Some data are also available from KIDS COUNT Data Center via https://datacenter.aecf.org/.
[1]Due to the margins of error, the difference in some 2022 and 2023 estimates is not statistically significant. Due to pandemic-related disruptions, detailed ACS year estimates are not available for 2020. The Census Bureau’s American Community Survey generates estimates based on a sample of the total population. The margin of error measures the likely range of the true value if every person were surveyed. When the error margins for two values overlap, the difference may simply be due to sampling or estimation issues. To learn more about the importance of samples, read our tips for interpreting statistics.

