Key Takeaways
- Adverse childhood experiences (ACEs) can increase a person’s risk of health, social, and economic problems throughout life.
- In 2017, ACEs among Tennessee adults led to an estimated $5.2 billion in direct medical costs and lost productivity from employees missing work.
- ACEs are associated with risky health behaviors and poorer health outcomes even after accounting for other factors.
- Over half of adult Tennesseans reported at least one ACE between 2014 and 2017, and about 17% had experienced 4 or more.
Figure 1
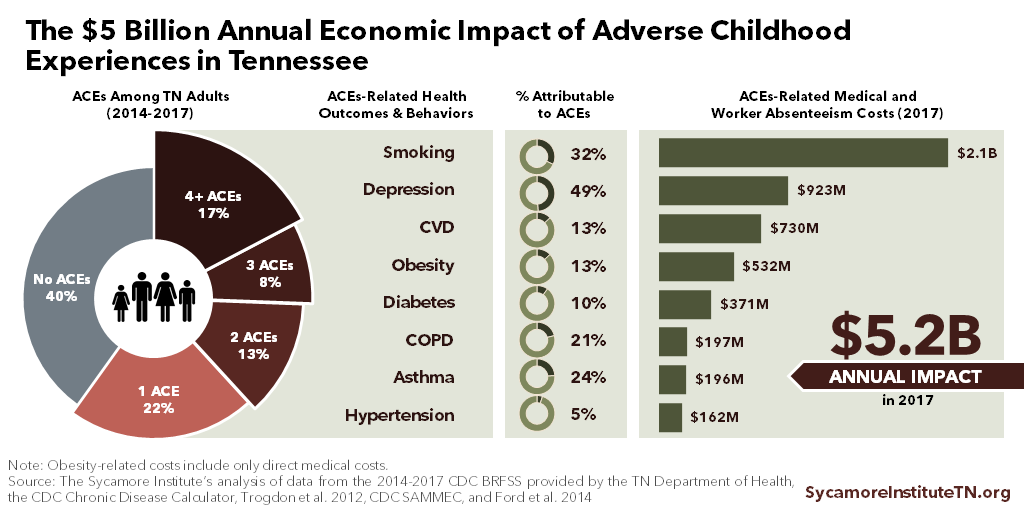
Adverse childhood experiences (ACEs) can disrupt healthy brain development in ways that affect health later in life. Abuse, neglect and household dysfunction can cause chronic and severe stress during childhood that is especially toxic to the developing brain. (7) (8) Studies show that as the number of ACEs increases, so does the risk of long-term health, social, and economic problems — including chronic disease, decreased work performance, and risky health behaviors. (9) (10)
The effects of ACEs are widespread and costly for individuals, families, and communities. Nationally, child abuse and neglect alone cost an estimated $124 billion in 2008 and $80 billion in 2012. These costs are shared across many sectors including health care, taxpayer-funded social services, law enforcement, and special education. (9) (11)
To better understand how ACEs affect Tennesseans and Tennessee’s economy, this study estimates the economic impact of ACEs-related health outcomes and behaviors in our state. The findings offer insight into the potential economic upside of efforts to prevent and mitigate ACEs.
The Economic Cost of ACEs in Tennessee
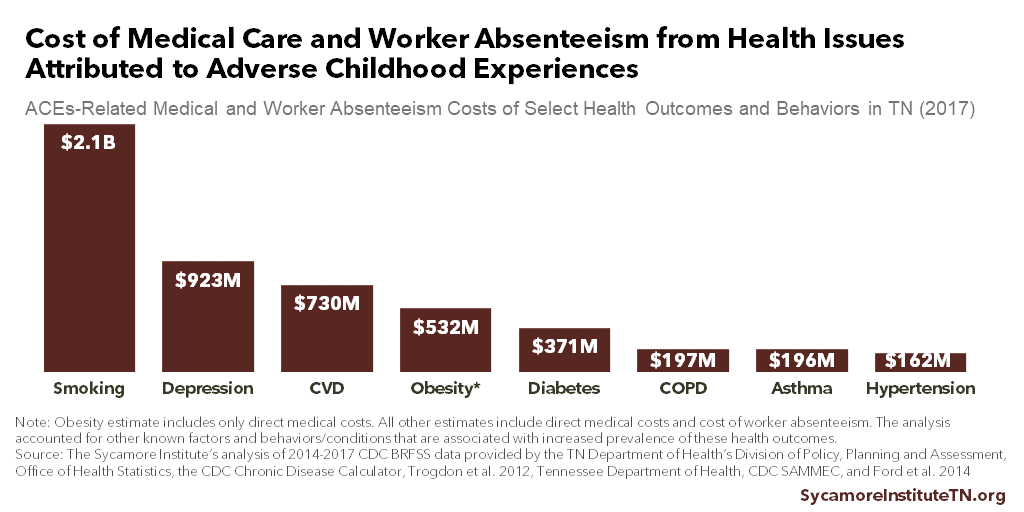
In 2017, ACEs among Tennessee adults led to an estimated $5.2 billion in direct medical costs and lost productivity from employees missing work (Figure 1). (1) (2) (3) (4) (5) (6) These costs are associated with eight ACEs-related health outcomes and behaviors. Among these, cigarette smoking ($2.1billion) and depression ($923 million) were the most costly (Figure 2).
The calculation of these estimates includes an adjustment to account for the other known factors and behaviors/conditions that are associated with increased prevalence of these health outcomes.
Implication for Tennessee’s Economy
These estimates begin to shed light on how ACEs shape Tennesseans’ health and influence our state’s economy. By affecting our health outcomes and behaviors, ACEs increase health care costs in taxpayer-funded programs like TennCare, raise employers’ costs for health care and productivity loss, and shrink earnings for employees who miss work. Efforts to prevent ACEs and mitigate their effects could potentially reduce those expenses. The details and costs of any such efforts fall outside this report’s scope.
Figure 2
Our Method
This study estimates the ACEs-related direct medical and worker absenteeism costs associated with eight health outcomes and behaviors. After determining the prevalence of ACEs reported by Tennessee adults between 2014 and 2017, we estimated the percentage of each health outcome or behavior that is connected to ACEs. This percentage is known as the population attributable risk (PAR).
We adjusted the PAR for other known associated factors like education, income, exercise habits, age, and overlapping chronic diseases. This serves to isolate the effects of ACEs from the effects of other factors. The adjusted PARs were then applied to annual estimates of Tennessee-specific direct medical costs and absenteeism for each health outcome and behavior.
See the Methods Appendix for a more detailed discussion of our methods.
The Prevalence of ACEs in Tennessee
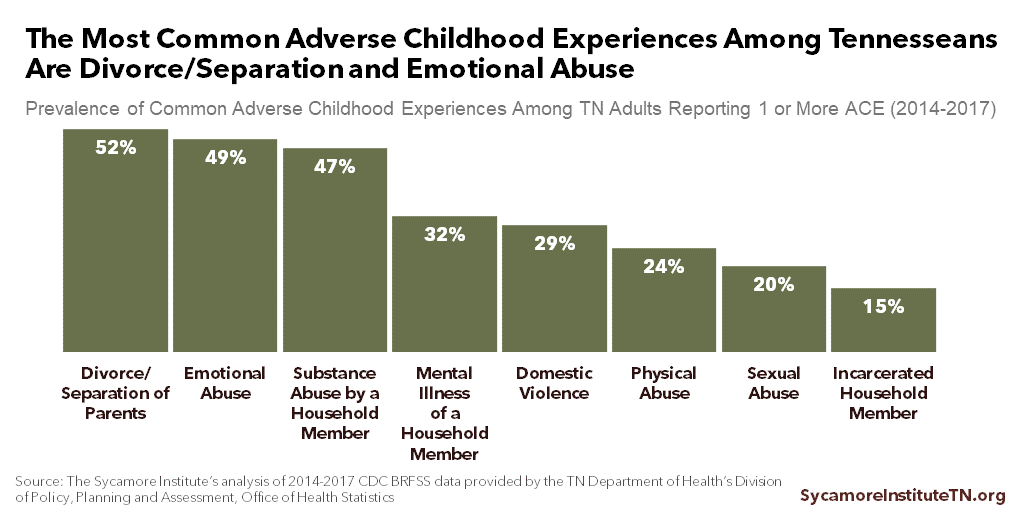
Over half of adult Tennesseans reported at least one ACE between 2014 and 2017, and about 17% had experienced four or more (Figure 3). (1) Of the 60% of people who reported at least one ACE, the most common were divorce or separation (52%) and emotional abuse (49%) (Figure 4).
Figure 3
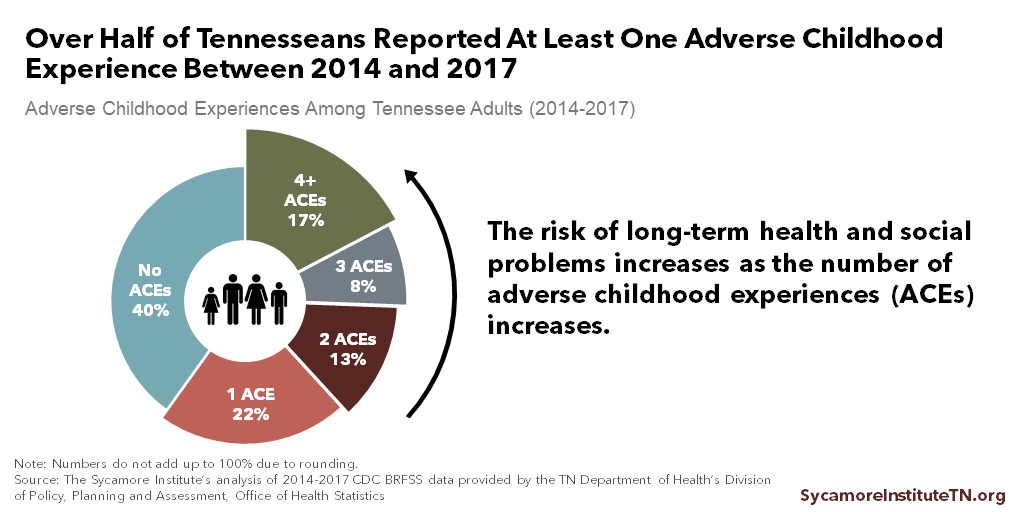
Figure 4
The Link Between ACEs and Health Outcomes and Behaviors
ACEs are associated with risky health behaviors and poorer health outcomes among Tennesseans, even after accounting for other factors. As the number of ACEs increases, so do rates of risky health behaviors like smoking (Figure 5) and poor health outcomes like depression (Figure 6), diabetes, obesity, poor/fair self-rated health status, cardiovascular disease (CVD) and chronic obstructive pulmonary disease. (1)
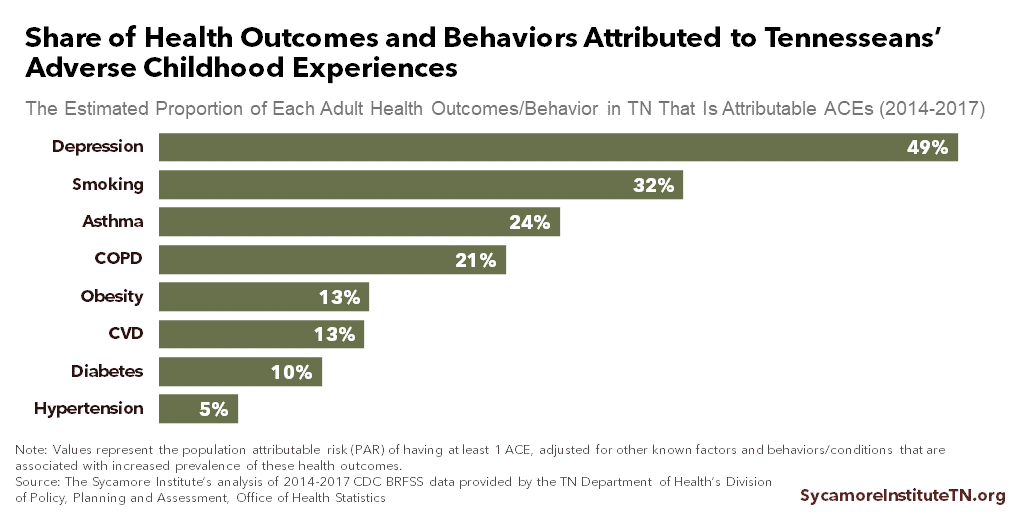
If all ACEs were eliminated, for example, we would expect 49% fewer adult Tennesseans with depression and 32% fewer adult cigarette smokers (Figure 7). (1)
Figure 5
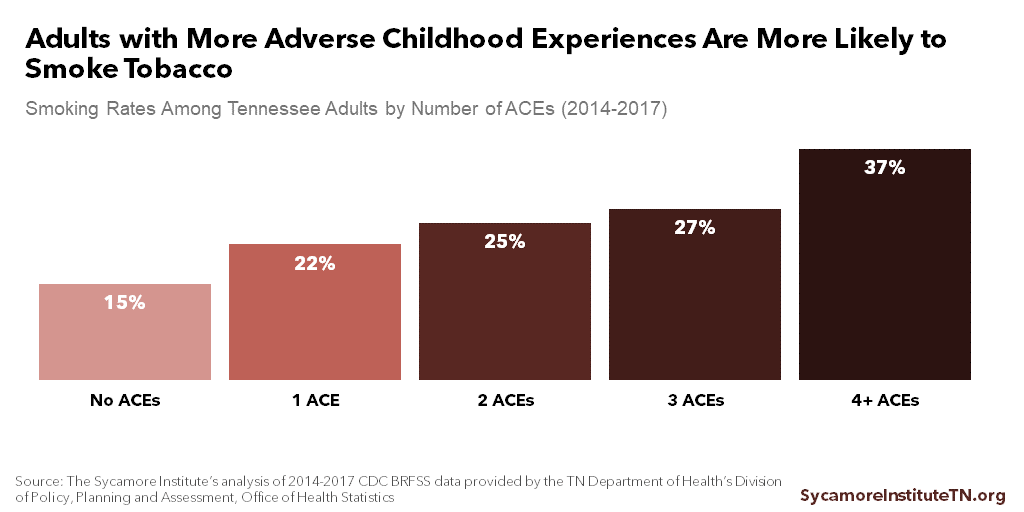
Figure 6
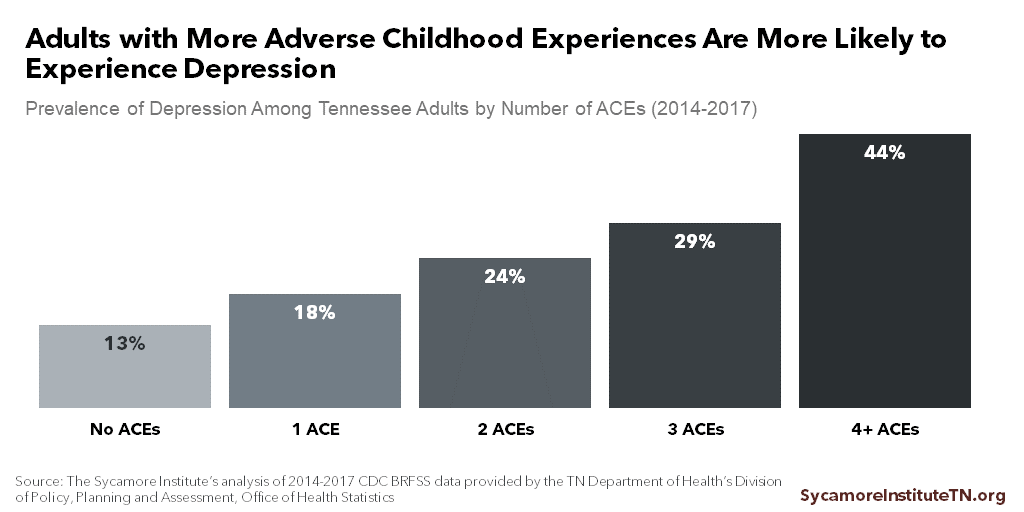
Figure 7
ACEs Are Fact, Not Fate
Exposure to ACEs does not guarantee that negative outcomes will follow. Some people with adverse childhood experiences do not have negative health and social outcomes. Likewise, not everyone with negative health outcomes was exposed to ACEs.
ACEs should be viewed from a population health perspective. Science has demonstrated the relationship between ACEs and adverse outcomes — along with the benefits of preventing and mitigating ACEs. Individual differences in environment, genetics, and other experiences also affect outcomes. Further research can help inform policies, resources, and programs that can effectively prevent and mitigate the effects of ACEs. (12)
Parting Words
Chronic, severe stress during childhood can disrupt healthy brain development. These adverse childhood experiences (ACEs) increase a person’s risk of health, behavioral, and social problems throughout life.
The negative health effects of ACEs carry significant economic costs for Tennessee. Efforts to prevent ACEs and mitigate their negative effects could potentially improve Tennesseans’ health and well-being while reducing economic costs of medical care and worker absenteeism.
References
Click to Open/Close
- Melton, Courtnee. The Sycamore Institute’s analysis of the U.S. Centers for Disease Control and Prevention’s (CDC) 2014-2017 Behavioral Risk Factor Surveillance System Data. Provided by the Tennessee Department of Health’s Division of Policy, Planning and Assessment, Office of Health Statistics. [Online] Public use data retrieved from https://www.cdc.gov/brfss/annual_data/annual_data.htm.
- U.S. Centers for Disease Control and Prevention (CDC). Chronic Disease Calculator. [Online] [Cited: February 2, 2018.] https://www.cdc.gov/chronicdisease/calculator/index.html.
- Trogdon, Justin G, et al. State- and Payer- Specific Estimates of Annual Medical Expenditures Attributable to Obesity. Obesity, 20(1): 214-220. [Online] January 2012. [Cited: February 2, 2018.] http://onlinelibrary.wiley.com/doi/10.1038/oby.2011.169/full.
- Tennessee Department of Health, Office of Policy, Planning and Assessment Surveillance, Epidemiology and Evaluation. The Burden of Tobacco in Tennessee. [Online] June 25, 2008. [Cited: February 2, 2018.] https://hit.health.tn.gov/Reports/ATOD/BurdenTobaccoTN.pdf.
- U.S. Centers for Disease Control and Prevention (CDC). Smoking-Attributable Mortality, Morbidity, and Economic Costs (SAMMEC). [Online] [Cited: February 2, 2018.] https://chronicdata.cdc.gov/Health-Consequences-and-Costs/Smoking-Attributable-Mortality-Morbidity-and-Econo/ezab-8sq5/data.
- Ford, Earl S, et al. Total and State-Specific Medical and Absenteeism Costs of COPD Among Adults Aged ≥ 18 Years in the United States for 2010 and Projections Through 2020. Chest, 147(1): 31-45. [Online] 2015. [Cited: February 2, 2018.] http://journal.chestnet.org/article/S0012-3692(15)30233-6/pdf.
- Middlebrooks, Jennifer S and Audage, Natalie C. The Effects of Childhood Stress on Health across the Lifespan. U.S. Centers for Disease Control and Prevention (CDC), National Center for Injury Prevention and Control. [Online] 2008. [Cited: February 2, 2018.] http://www.theannainstitute.org/ACE%20folder%20for%20website/45%20Effects%20Childhood%20Stress%20ac%20lifespan%20CDC.pdf.
- McEwen, Bruce S. Understanding the Potency of Stressful Early Life Experiences on Brain and Body Function. Metabolism, 57(Suppl 2): S11-S15. [Online] October 2008. [Cited: February 2, 2018.] https://www.ncbi.nlm.nih.gov/pmc/articles/PMC2567059/pdf/nihms71938.pdf.
- Fang, Xiangming, et al. The Economic Burden of Child Maltreatment in the United States and Implications for Prevention. Child Abuse & Neglect, 36(2): 156-165. [Online] 2012. [Cited: February 2, 2018.] https://www.ncbi.nlm.nih.gov/pmc/articles/PMC3776454/pdf/nihms508485.pdf.
- Anda, Robert, et al. Childhood Abuse, Household Dysfunction, and Indicators of Impaired Adult Worker Performance. The Permanente Journal, 8(1): 30-38. [Online] Winter 2004. [Cited: February 2, 2018.] https://www.ncbi.nlm.nih.gov/pmc/articles/PMC4690705/pdf/permj08_1p0030.pdf.
- Gelles, Richard J and Perlman, Staci. Estimated Annual Cost of Child Abuse and Neglect. Prevent Child Abuse America. [Online] 2012. [Cited: January 25, 2019.] http://preventchildabuse.org/wp-content/uploads/2016/02/PCA_COM2012-1.pdf.
- Sidmore, Patrick. Economic Costs of Adverse Childhood Experiences in Alaska: The Price of Not Intervening Before Trauma Occurs. Alaska Department of Health and Social Services. [Online] 2015. [Cited: February 2, 2018.] http://dhss.alaska.gov/abada/ace-ak/Documents/ACEsEconomicCosts-AK.pdf.
- Dube, Shanta R, et al. Childhood Abuse, Household Dysfunction, and the Risk of Attempted Suicide Throughout the Life Span: Findings from the Adverse Childhood Experiences Study. JAMA, 286(24): 3089-3096. [Online] 2001. [Cited: February 2, 2018.] https://jamanetwork.com/journals/jama/fullarticle/194504.
- U.S. Centers for Disease Control and Prevention (CDC). The Behavioral Risk Factor Surveillance System: Complex Sampling Weights and Preparing 2017 BRFSS Module Data for Analysis. [Online] July 2018. https://www.cdc.gov/brfss/annual_data/2017/pdf/Complex-Smple-Weights-Prep-Module-Data-Analysis-2017-508.pdf.
- Rockhill, Beverly, Newman, Beth and Weinberg, Clarice. Use and Misuse of Population Attributable Fractions. American Journal of Public Health, 98(12): 2119. [Online] 1998. https://www.ncbi.nlm.nih.gov/pmc/articles/PMC1508384/.
- Levine, Beverly. What Does the Population Attributable Fraction Mean? Preventing Chronic Disease, 4(1): 1-5. [Online] January 2007. https://www.ncbi.nlm.nih.gov/pmc/articles/PMC1832135/pdf/PCD41A14.pdf.
- Columbia University Mailman School of Public Health. Adjusted Attributable Fractions. [Online] [Cited: February 2, 2018.] https://www.mailman.columbia.edu/research/population-health-methods/adjusted-attributable-fractions.
- Schenck, Louis, et al. Package ‘attribrisk’. The Comprehensive R Archive Network (CRAN). [Online] February 19, 2015. [Cited: November 8, 2018.] https://cran.r-project.org/package=attribrisk.
- Trogdon, Justin G, et al. Costs of Chronic Diseases at the State Level: The Chronic Disease Calculator. Preventing Chronic Disease, 12: 150131. [Online] September 3, 2015. [Cited: January 25, 2019.] https://www.cdc.gov/pcd/issues/2015/15_0131.htm.
- U.S. Bureau of Economic Analysis (BEA). National Income Product Account Tables. Section 1 Domestic Product and Income, Table 1.1.4 Price Indexes for Gross Domestic Product. [Online] https://www.bea.gov/iTable/index_nipa.cfm.
- Santerre, Rexford E and Neun, Stephen P. Health Economics: Theory, Insights, and Industry Studies. Mason : South-Western CENGAGE Learning, 2010.
- Centers for Disease Control and Prevention (CDC). Behavioral Risk Factor Surveillance System Overview: BRFSS 2017. [Online] July 16, 2018. [Cited: January 25, 2019.] https://www.cdc.gov/brfss/annual_data/2017/pdf/overview-2017-508.pdf.
- Rosenman, Robert, Tennekoon, Vidhura and Hill, Laura G. Measuring Bias in Self-reported Data. International Journal of Behavioral Healthcare Research, 2(4): 320-332. [Online] 2011. [Cited: January 25, 2019.] https://www.ncbi.nlm.nih.gov/pmc/articles/PMC4224297/.
Featured photo at top by Brian Smith

