Labor force participation tells us about the current and potential size of Tennessee’s workforce. Tennessee’s ability to produce the goods and services that drive the economy depends in part on the availability of people to work. (1) Meanwhile, workforce participation fundamentally affects families’ incomes, both spending and savings – with implications for both individual well-being and our entire economy.
Key Takeaways
- The labor force participation rate measures the share of a population age 16 and older that is working or actively looking for work. It is a common way to measure the health of the labor market.
- Tennessee’s labor force participation rate is consistently lower than the national average, but the gap has narrowed in recent years as the state’s rate has grown.
- The labor force participation rate sheds light on people’s willingness to work at a given time but doesn’t show why some aren’t working or seeking work. It can also obscure disparities among groups in an area.
- Labor force participation can fluctuate due to trends that are not necessarily tied to the health or distress of the broader economy.
This is part of our series on the pros and cons of five common ways to measure prosperity and economic growth in Tennessee.
What is Labor Force Participation?
Labor force participation measures the share of a population age 16 and older that is working or actively looking for work. (4) Unemployment rates and labor force participation rates typically move in opposite directions: when unemployment falls, labor force participation usually rises. Examples of people not considered part of the labor force include those who are retired or too sick to work, full-time parents and students, and “discouraged workers” who want a job but have not looked for one in the past four weeks.
Figure 1

Labor Force Participation in Tennessee
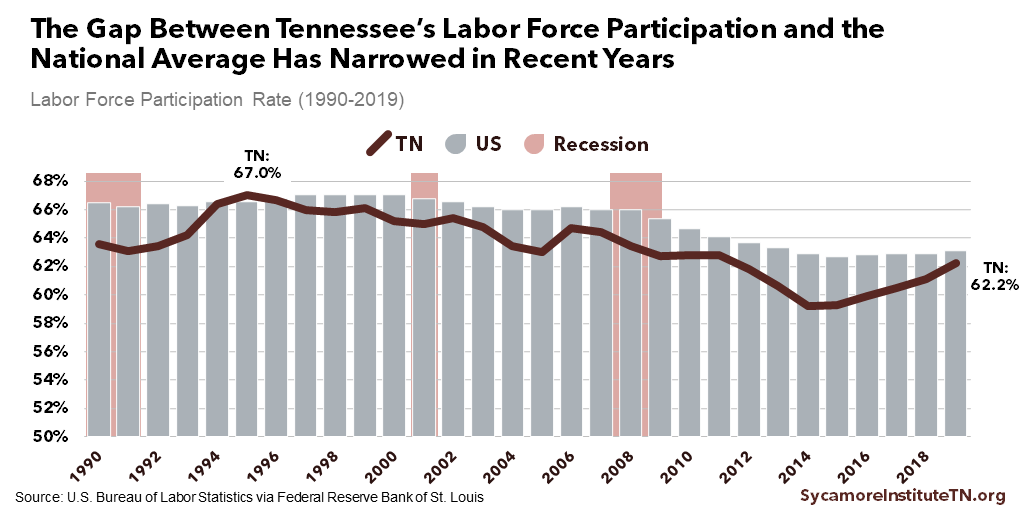
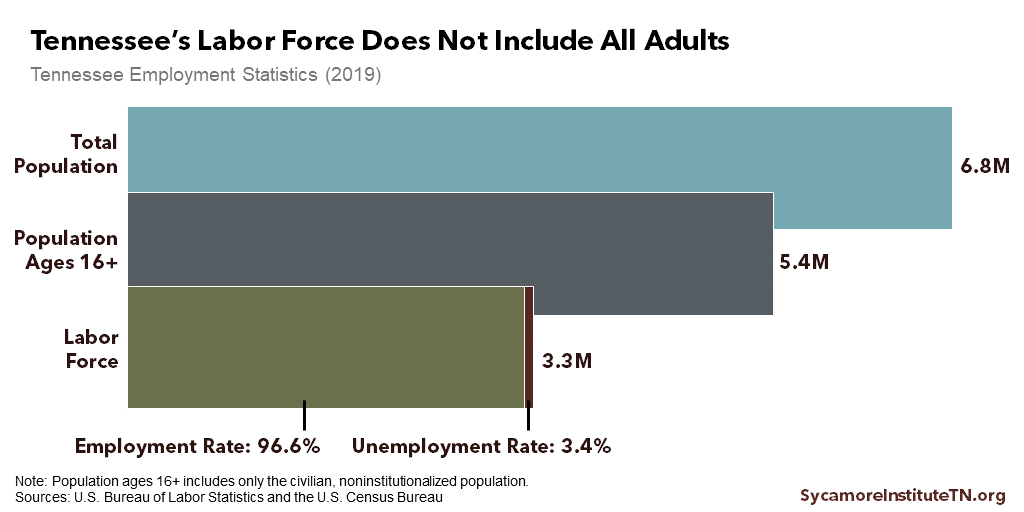
Tennessee’s labor force participation rate is consistently lower than the national average, but the gap has narrowed in recent years (Figure 1). In 2019, the rate was 62% in Tennessee vs. the national average of 63%. (3) (2) Figure 2 displays the relationship between labor force participation, the state’s population, and employment figures.
Tennessee’s labor force participation rate peaked in 1995 at 67% and reached a low point of 59% in 2014. In an unusual occurrence, labor force participation in Tennessee fell from 2011 to 2014 even as the unemployment rate also decreased. Since 2014, labor force participation in Tennessee has rebounded slightly but remains at historically low levels. (2)
Figure 2

Trade-Offs of Using Labor Force Participation to Measure Prosperity
Advantages of the Measure
The labor force participation rate offers several advantages for tracking and describing the labor market. (7) (8)
- The labor force participation rate sheds light on people’s willingness to work at any given time. It conveys information on the number of people working or seeking work, the availability of jobs, and people’s confidence in their ability to secure employment.
- The rate provides a standardized way to track changes in the economy over time across geographic areas. Data are collected and reported every month at the national, state, and county levels.
Limitations of the Measure
The labor force participation rate also has some characteristics that prevent it from offering a comprehensive picture of Tennessee’s workforce. (7)
- The labor force participation rate only measures one dimension of the labor market: people who have or currently seek a job. It does not account for other important aspects such as actual employment, hours worked, wages earned, or worker productivity.
- Monthly labor force participation rates do not provide information about differences across demographic groups in an area. Like all population-level metrics, topline figures can obscure disparities. However, annual data from the Census Bureau’s American Community Survey provides a richer understanding of the labor force across different populations and demographics.
- Labor force participation can fluctuate due to trends that are not necessarily tied to the health or distress of the broader economy. For example, people attending school or raising children full-time contribute to the economy but are not considered part of the labor force. The rate also decreases as a population ages and more people retire. These demographic trends have important long-term implications for the economy, but they do not necessarily reflect current economic conditions.
References
Click to Open/Close
- Hotchkiss, Julie L. Decomposing Changes in the Aggregate Labor Force Participation Rate (Working Paper 2009-6a). Federal Reserve Bank of Atlanta. [Online] July 2009. https://www.frbatlanta.org/-/media/documents/research/publications/wp/2009/wp0906a.pdf.
- U.S. Bureau of Labor Statistics (BLS). Tennessee Civilian Labor Force Participation Rate (LBSSA47). [Online] [Cited: April 3, 2020.] Retrieved from FRED, Federal Reserve Bank of St. Louis via https://fred.stlouisfed.org/series/LBSSA47.
- —. U.S. Civilian Labor Force Participation Rate [CIVPART]. [Online] [Cited: April 3, 2020.] Retrieved from FRED, Federal Reserve Bank of St. Louis via https://fred.stlouisfed.org/series/CIVPART.
- —. How the Government Measures Unemployment. [Online] October 8, 2015. https://www.bls.gov/cps/cps_htgm.htm.
- U.S. Bureau of Labor Statistics. Local Area Unemployment Statistics. [Online] [Cited: April 3, 2020.] Accessed via https://data.bls.gov/pdq/SurveyOutputServlet.
- U.S. Census Bureau. Population Estimates, July 1, 2019. [Online] [Cited: April 3, 2020.] Accessed from https://www.census.gov/quickfacts/TN.
- Council of Economic Advisers. The Labor Force Participation Rate Since 2007: Causes and Policy Implications. Executive Office of the President of the United States. [Online] July 2014. https://obamawhitehouse.archives.gov/sites/default/files/docs/labor_force_participation_report.pdf.
- Donovan, Sarah A. An Overview of the Employment-Population Ratio. Congressional Research Service. [Online] May 25, 2015. https://fas.org/sgp/crs/misc/R44055.pdf.
