Tennessee’s budget is one of the most significant pieces of public policy our governor and General Assembly tackle each year. Yet understanding what’s in it, why it matters, and how it works can be a challenge.
Sycamore’s Budget Primer explains Tennessee’s finances to help you understand state government and advocate for policies you support. Our signature publication unpacks the process, breaks down the numbers, and explores historical trends using simple language and charts.
The new 3rd edition is better than ever and makes it even easier to find and digest the information you need! Buy one for yourself and a few more to share with your colleagues, friends, students, and public officials.
Support our work by purchasing copies for just $25 each.
Download the free PDF version here:
A Preview of What’s Inside
Budget Highlights
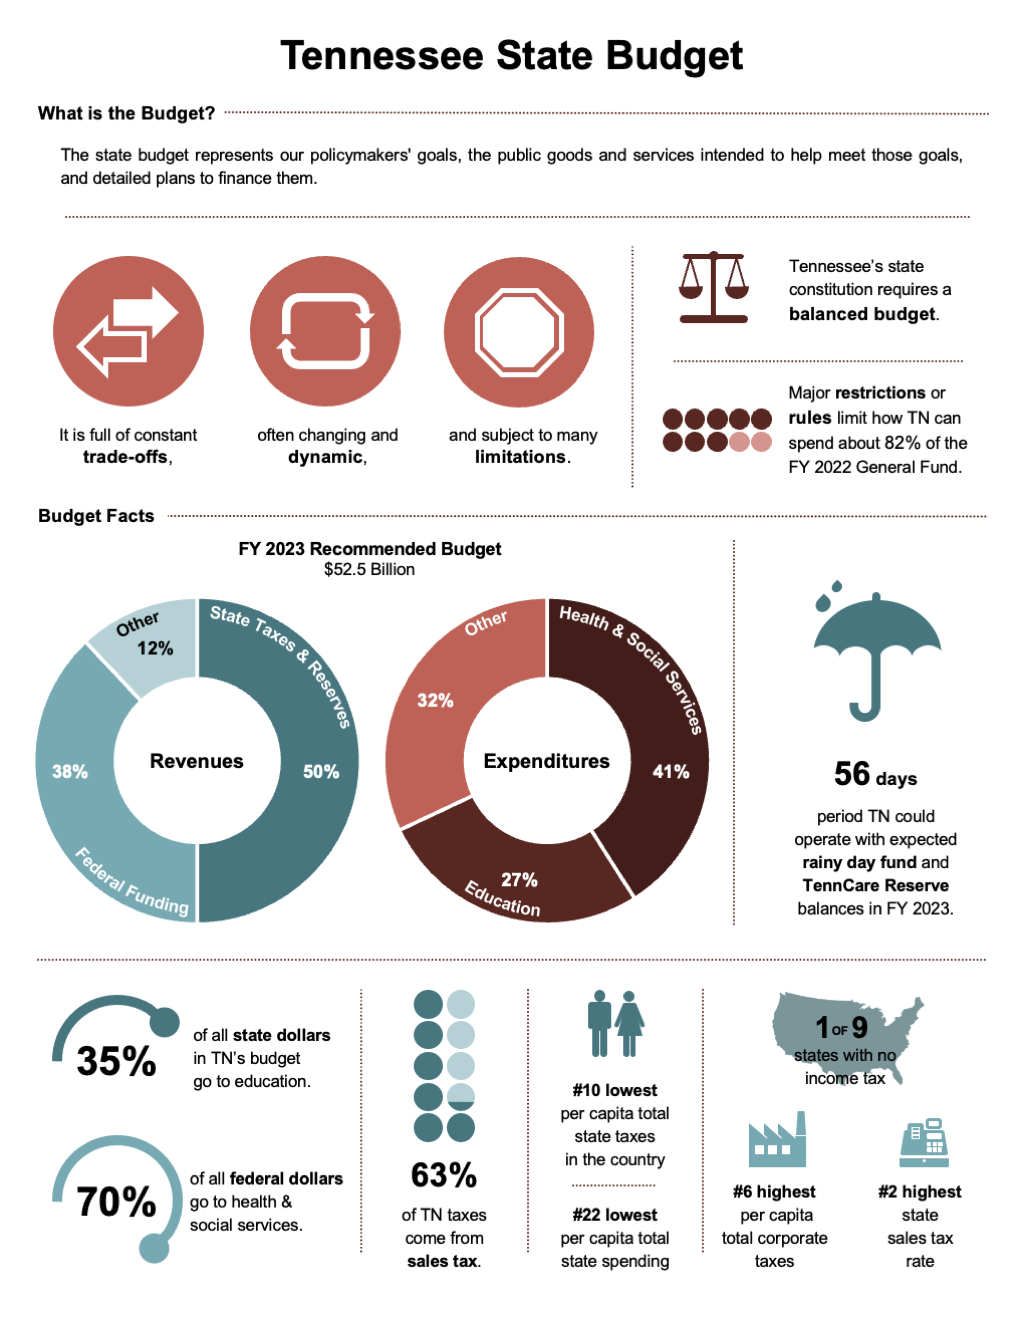
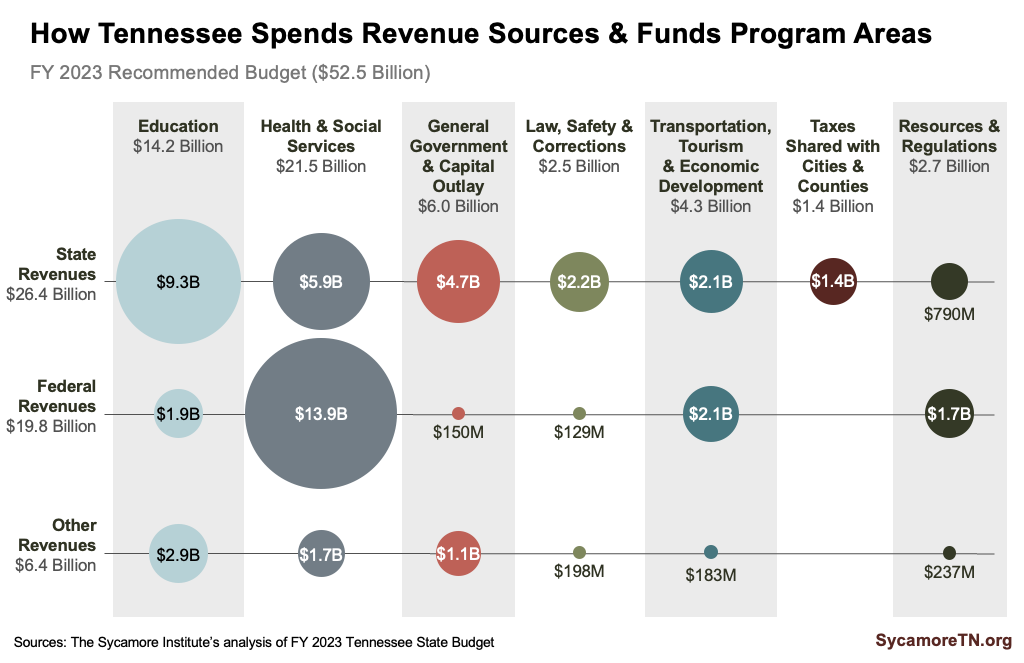
The governor’s FY 2023 recommended budget totaled $52.5 billion. Over two-thirds (68%) went toward health and social services (41%) and education (27%). The money primarily came from the state’s own taxes and reserves (50%) and federal funding (38%).
Process
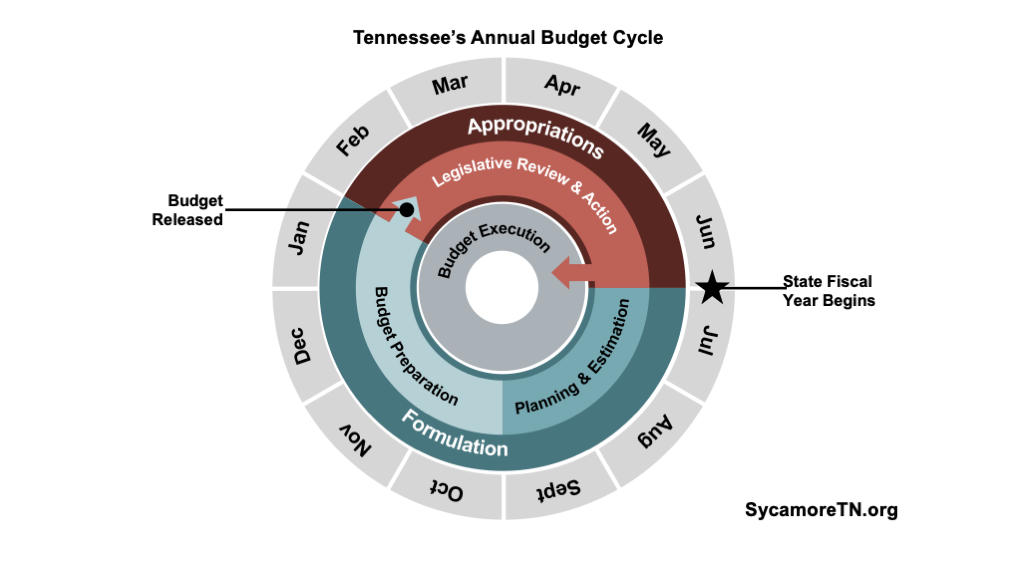
- Fiscal Year – The state’s fiscal year (FY) begins July 1st and ends June 30th.
- Starting Point – Early each year, the governor sends the legislature a recommended budget that builds off the prior year’s recurring base budget. The governor’s recommendation is the starting point for the legislature’s work.
- Balanced Budget Requirement – Tennessee’s constitution requires the budget to balance. This means that in each fiscal year spending cannot exceed revenue collections plus reserves.
- Dynamic – To meet this requirement, the budget is often dynamic. As revenue collection estimates change throughout both the planning and spending phases, the budget also changes.
- Budget Management – The executive branch has flexibility to reduce spending and manage the budget to keep it balanced during the fiscal year.
Expenditures
- State Revenue Spending – Funding for education, general government and capital outlay, and law, safety, and corrections programs and activities largely comes from state revenues. Education accounts for 35% of all state dollars in the budget, followed by health and social services at 23%.
- Federal Revenue Spending – Federal dollars fund the lion’s share of health, social services, transportation, and economic development programs and activities. Health and social services account for 70% of all federal dollars in the state budget.
- Overall Spending Levels – With 1st being the highest, Tennessee ranked 38th in the U.S. for per capita state spending in FY 2021 when accounting for all revenue sources. Its per capita spending from state revenue sources was the 29th highest.
- Spending Growth – The extent of growth in Tennessee’s recurring spending depends on how it’s measured. Total and per capita spending reached the highest levels in three decades in FY 2022. As a percent of state personal income and GDP, however, spending fell to historic lows.
Revenues
- Overall Tax Burden – Tennesseans have a relatively low state tax burden. At about $2,300 per Tennessean, the state tax burden was the 10th lowest in the country in FY 2020. Because the state has no income tax, however, many of Tennessee’s other taxes are high compared to those taxes in other states.
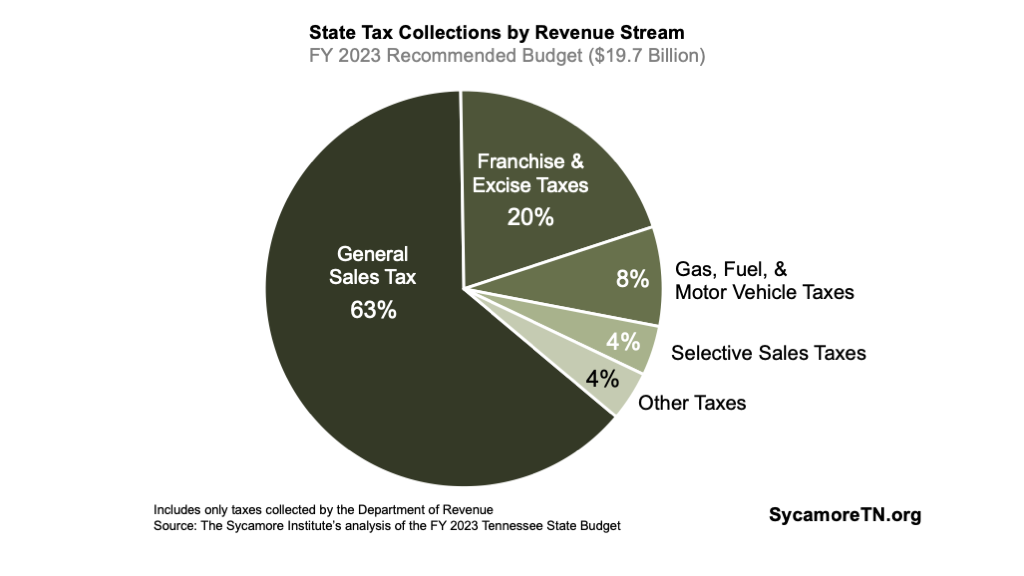
- Sales Tax – The sales tax is Tennessee’s largest source (63%) of state tax revenue. At 7%, Tennessee’s state sales tax rate is the 2nd highest in the U.S.
- Federal Reliance – With 1st being the highest, Tennessee ranks 8th for the share of federal funds in the state budget.
- Strings Attached – Most of the money in the state budget has strings attached — such as programmatic and/or matching requirements for federal dollars, state revenues earmarked for specific purposes, or funding required by lawsuits against the state.
- Discretionary Base – Only 18% of total FY 2022 General Fund spending was considered “discretionary.” The General Fund was about 87% of the total FY 2023 recommended budget.
Surpluses, Deficits, and Rainy Day Funds
- Projecting Revenues – The accuracy of state tax projections plays a major role in whether surpluses and deficits occur. Recent history suggests that making projections is difficult and rarely accurate.
- Surpluses – A surplus occurs when Tennessee has collected more and/or spent less money at the end of a fiscal year than lawmakers budgeted. Not all reserves are surplus, and in fact, most of the state’s unspent reserves are tied up in specific requirements and obligations.
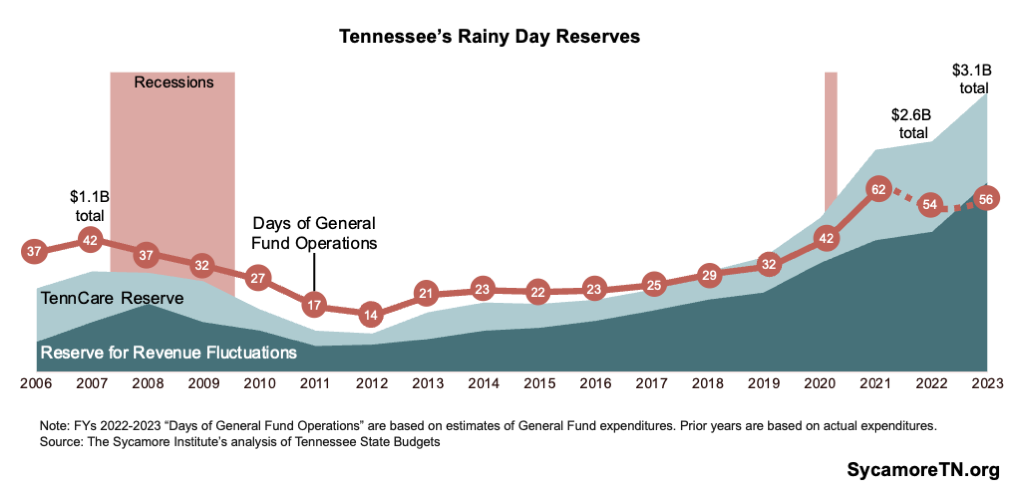
- Recession Readiness – Tennessee could fully fund current state government operations for around 56 days with rainy day and TennCare reserves alone. That’s about 34% more cushion than the state had going into the Great Recession.
- Rainy Day Best Practices – Tennessee follows most of the best practices when it comes to saving for a rainy day — including defining a purpose in law, setting a target balance, and having rules for replenishment.
- Long-Term Liabilities – Tennessee maintains trust funds to pre-fund long-term liabilities for state employee retiree benefits and is among the top states in the nation for covering these obligations.
Order Yours Today
The budget primer in its entirety features an in-depth look at topics like the budget process, recent recessions, and how federal funding impacts the Tennessee budget. Our 63 page primer provides an accessible foundation to understanding our state’s public policies. Your purchase supports Sycamore’s work to equip civic leaders across Tennessee with data-driven resources to identify, understand, and solve big challenges!


