

Key Takeaways
- Population and socioeconomic trends have driven a surge in housing demand in and across Tennessee—particularly since 2020.
- In the early 2020s, Tennessee welcomed new residents from wealthier parts of the country, and many of its residents moved out of urban cores into more rural areas.
- Because Tennessee’s housing supply hasn’t kept up with these demands, housing costs have become increasingly expensive.
- Some areas and populations in Tennessee may feel these housing challenges more than others. For example, higher housing prices have increasingly seeped into Tennessee’s rural areas.
- The data don’t tell the whole story. For example, available data limits detailed local analysis, housing buzzwords don’t always have clear definitions, and some housing choices aren’t well understood.
Housing is a key driver of individual and family well-being and an important component of thriving communities, but recent changes in Tennessee’s housing market could make those goals harder to achieve. This brief explains how historic changes in Tennessee’s housing market, population, and economy have converged over the last two decades.
Background
The story of Tennessee’s housing market and how it got to this point is an imbalance in the basic economic principles of supply and demand. (1) The construction of new homes (i.e., new supply) in Tennessee began to slow in 2006, fell dramatically during the Great Recession, and hit a historic low in 2011. (2) (3) While new homes steadily became available during the 2010s, supply never caught up to the demand created by Tennessee’s growing population. When the pandemic hit in 2020, new forces amplified these dynamics. (4) A still-recovering housing stock met an influx of wealthy new residents from other states and a migration of existing residents from urban to rural areas within the state. (5) (6) (7) As a result, housing has become increasingly expensive across Tennessee—including in rural areas that have not traditionally faced these challenges. (8)
The following sections explain the numbers underlying this story, what they mean for Tennesseans, how these effects vary across the state, and limitations of available data.
A Quick Note on Terminology
Throughout this report, the terms “homes,” “residences,” or “housing” generally refer to all types of residential dwellings—owned or rented—including multifamily and single-family units. The report uses more precise terminology when referring to a specific type of housing.
Figure 1
1. Population and socioeconomic trends have driven a surge in housing demand in and across Tennessee—particularly since 2020.
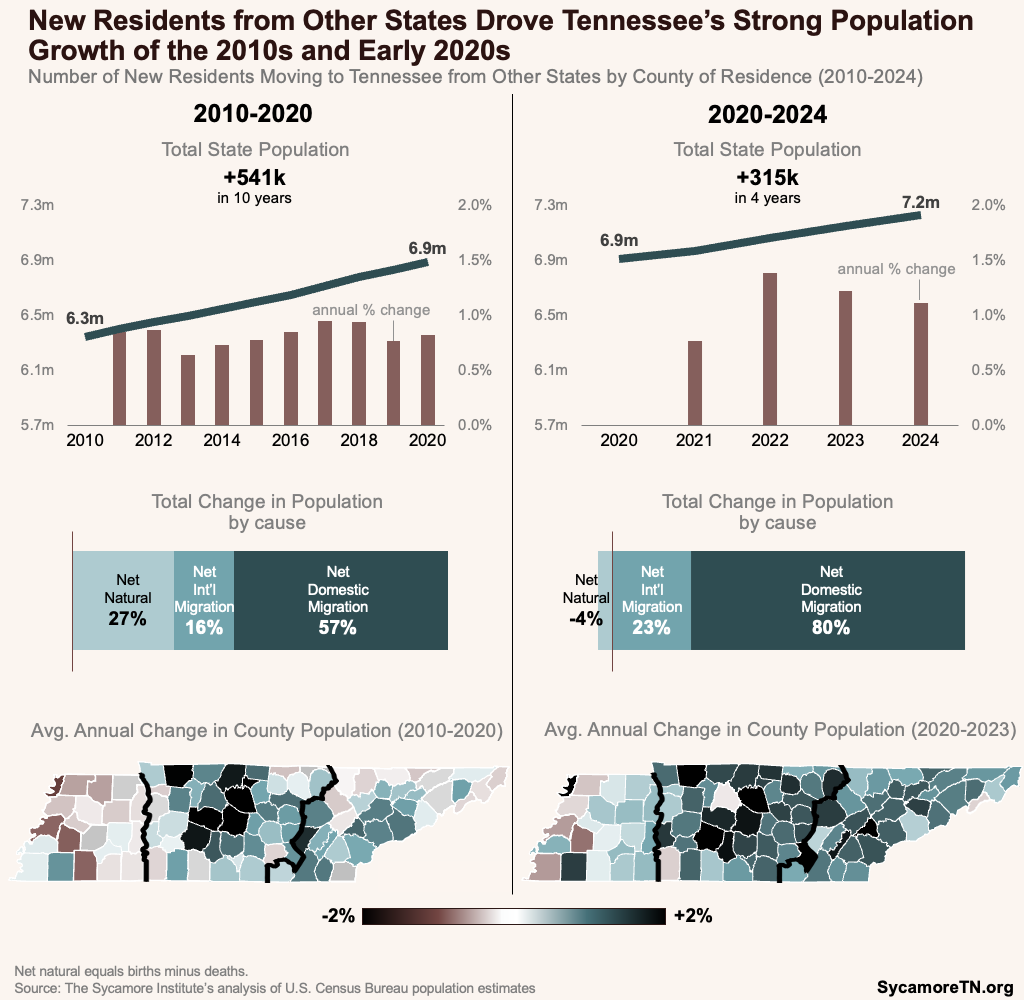
Tennessee’s population grew in the 2010s—largely from new residents moving from other states. From 2010 to 2020, Tennessee’s population grew by about 541,000—or 0.8% per year on average—with 65 counties experiencing population increases (Figure 1). About 57% of this statewide growth came from about 309,000 in net new residents moving in from other states (i.e., the difference between those moving in and out of Tennessee). (9)
The migration rate from other states grew even faster once the pandemic started—particularly in urban and suburban areas in Middle and East Tennessee. (See “Geographic Designations” text box for definitions of “urban” and “suburban.”) From 2020 to 2024, Tennessee’s population grew by another 315,000—or about 1.1% per year on average (Figure 1). This time, about 80% of this statewide growth came from over a quarter million in net new residents from other states. Between 2020 and 2023, 86 counties experienced population increases. Most new residents from other states relocated to Tennessee’s most populous counties—with most moving to East and Middle Tennessee (Figure 2). (10)
Figure 2
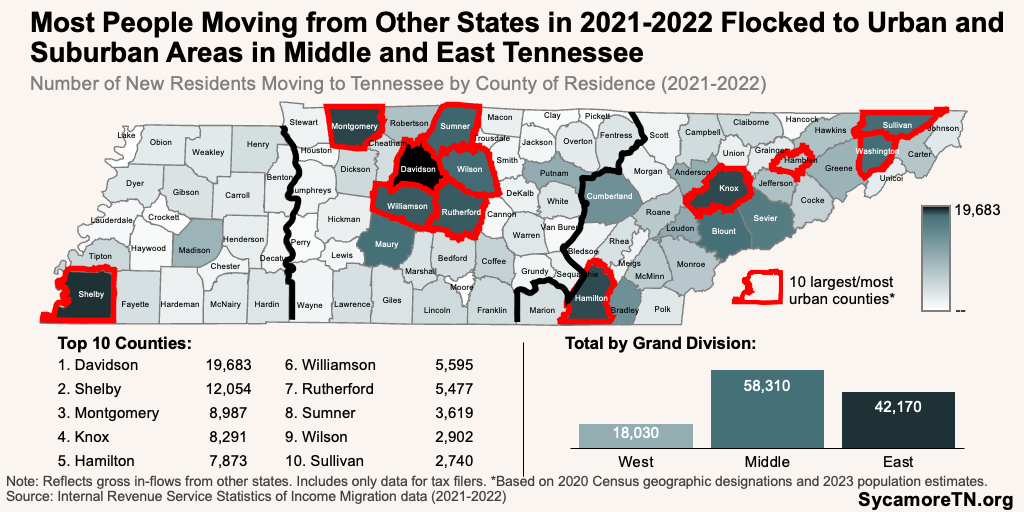
Many of Tennessee’s new residents moved from wealthier, higher-priced markets and brought high incomes—intensifying demand-side housing pressures. For example, California’s Los Angeles, Orange, and San Diego counties and Illinois’ Cook County were among the top five counties from which Tennessee’s new residents arrived between 2021 and 2022. These counties all had higher median incomes and home prices than most of Tennessee’s top destination counties (Figure 3), and federal tax data show these residents added significant new wealth to the counties they moved to. (12) (13) (14) These dynamics, paired with the increased demand of a growing population, put even more pressure on housing prices.
Figure 3

Meanwhile, some existing residents moved from urban to more suburban and rural areas—further affecting the demand for housing across entire regions. (7) (15) (See “Geographic Designations” text box for the definition of “rural.”) For example, several of Tennessee’s largest counties lost residents on net to other counties within the state between 2021 and 2022 (Figure 4). (12) In Middle Tennessee, for instance, people increasingly moved out of Davidson and into its bordering counties (Figure 5) and from Davidson’s bordering counties into the surrounding areas. (12) Federal tax data show that those moving into many Middle Tennessee counties had higher average incomes than those moving out (Figure 6). (13) (14) This means some areas experienced regional dispersals of both population and wealth.
Figure 4
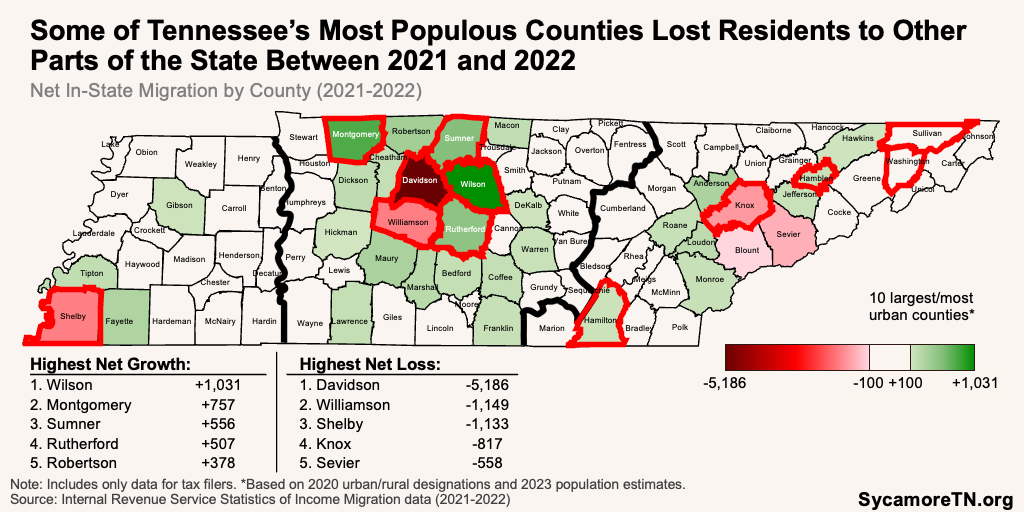
Figure 5
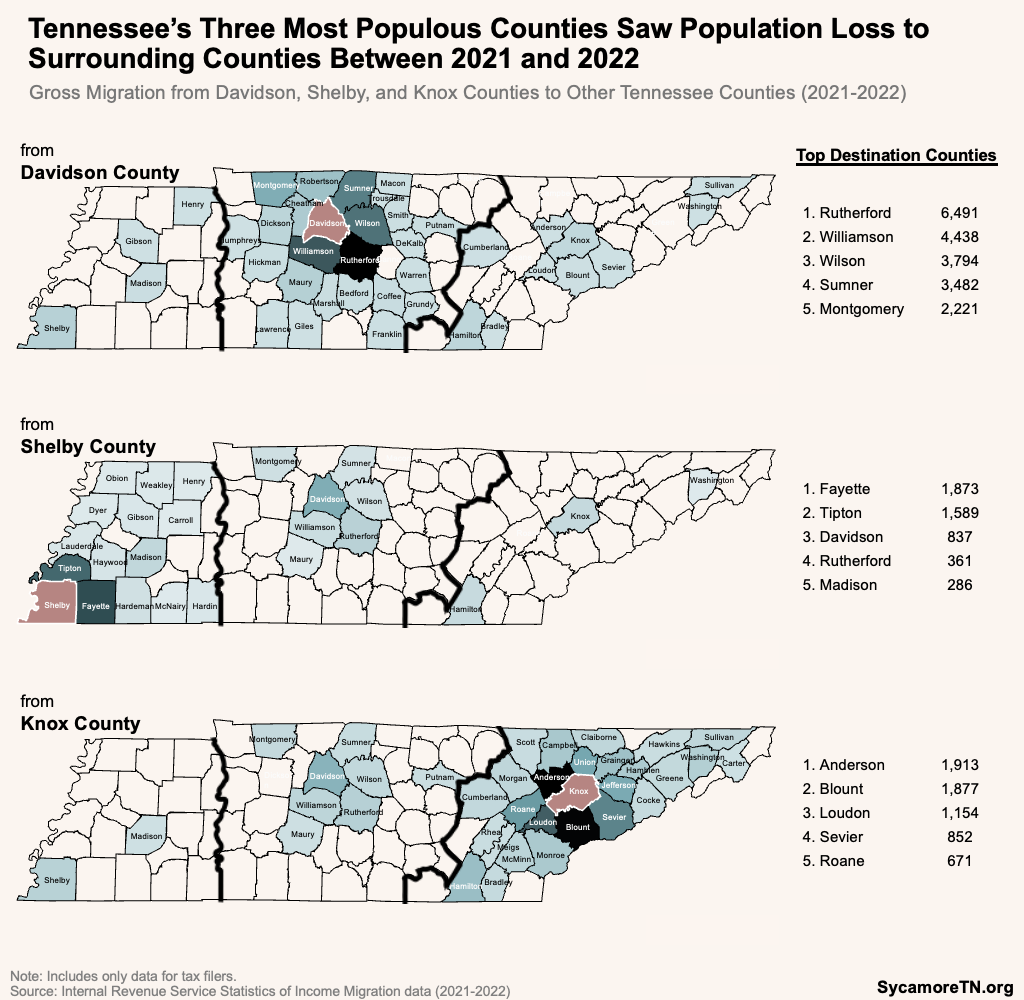
Figure 6

2. Tennessee’s housing supply hasn’t kept up with these demands.
Tennessee’s new housing production declined before, during, and after the Great Recession of 2007-2009. Leading up to the recession, widespread subprime mortgage lending and risky financial products led to an increased demand for homes. However, when homebuyers nationwide started defaulting on loans, beginning in 2006, demand for homes plummeted—eventually causing the market to crash. This resulted in an oversupply of homes, a severe drop in home production, and a prolonged period of depressed home prices. (16) In Tennessee—like the rest of the country—new home production nosedived and remained at historic lows through 2011 (Figure 7). (3)
Figure 7
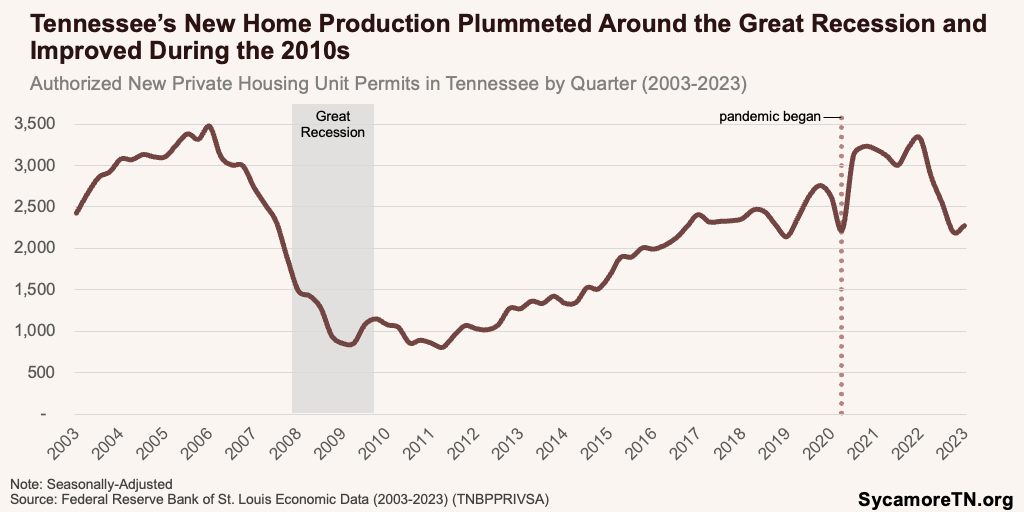
New home production began to steadily recover in 2012 and reached historic highs in 2020 and 2021. Data for 2003-2023 show a historically high number of residential permit approvals for 2020 and 2021. (18) Most of this development occurred in Middle Tennessee and urban areas. Of the nearly 250,000 new residential units approved for construction between 2019 and 2023, over half were in the Nashville metro area alone, and 94% were in Tennessee’s 10 metro areas. (19) (18)
Despite this growth, the state’s overall supply has not kept up with demand, reaching an all-time low during the pandemic. (4) (20) “Months’ supply” compares the number of houses listed for sale with the number of buyers looking for a home. As this number becomes smaller, it indicates more demand, less supply, or both—which tends to result in higher prices. Generally, six months’ supply is the sweet spot for housing markets to appreciate at a consistent rate. (21) After bottoming out in 2011, a slow increase in new housing production eventually contributed to 2013-2014’s solid 6.4 months’ supply. Then, it fell all the way to 1.7 months’ supply in 2021 (Figure 8). (17) In other words, the number of people looking to buy a home and the number of homes for sale each month was just above a one-to-one ratio throughout 2021, despite increased housing production.
Figure 8

Data on vacancy rates show that supply issues—especially a shortage of homes for sale—are particularly acute in some areas. Another measure of supply adequacy is the vacancy rate. A homeowner vacancy rate between 1.5% and 2.0% and a rental vacancy rate between 5.5% and 6.0% is considered healthy.[1] (23) (24) (25) In 2023, the statewide homeowner vacancy rate was 1.0% (low), and the rental vacancy rate was 6.1% (reasonably healthy). (13) Data for the five-year period from 2019 to 2023—the most recent available—show that most counties had low homeowner and rental vacancy rates (Figures 9 and 10).
Figure 9
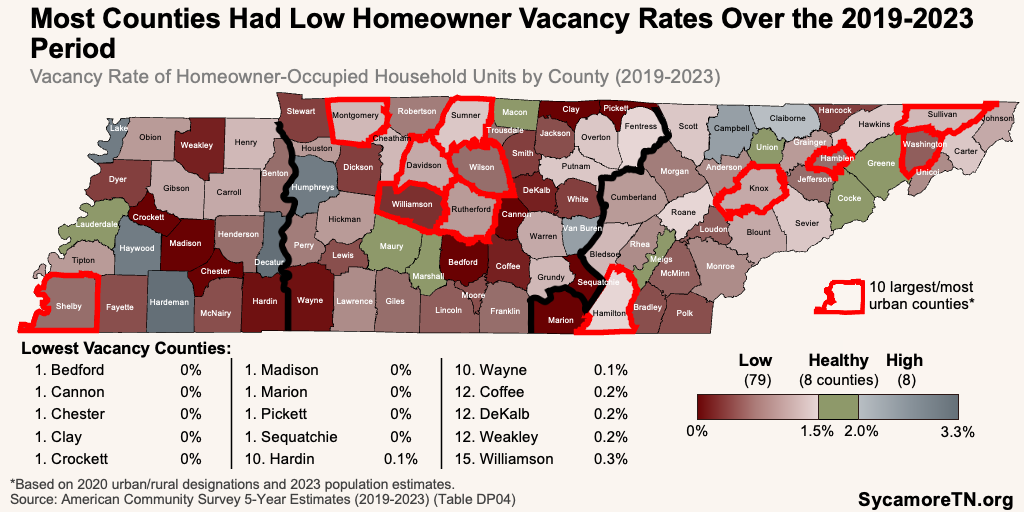
Figure 10

3. Because demand has outstripped supply, housing costs have become increasingly expensive in Tennessee.
Over the last decade, housing costs have grown significantly faster than incomes for most Tennesseans. When there is more demand for an item than supply, the price typically increases, and the same goes for housing. For context, about 67% of Tennessee households were owner-occupied in 2023, and the remaining 33% were rentals (Figure 11). According to measures used by experts, both types of housing have become more expensive:
- Homes Values and Sales Prices v. Income — Since 2013, median home values and sales prices in Tennessee have grown significantly faster than the typical household income (Figure 12). Between 2013 and 2023, median home values rose 40% and sales prices grew 170%, while median incomes grew 14% after adjusting for inflation. Put another way, the home price-to-income ratio jumped by 35%—from 3.72 to 5.03 (Figure 13). (19) (13) A ratio of 3.0 or below is generally recognized as affordable (i.e., a typical home costs about three times a typical annual household income). (26)
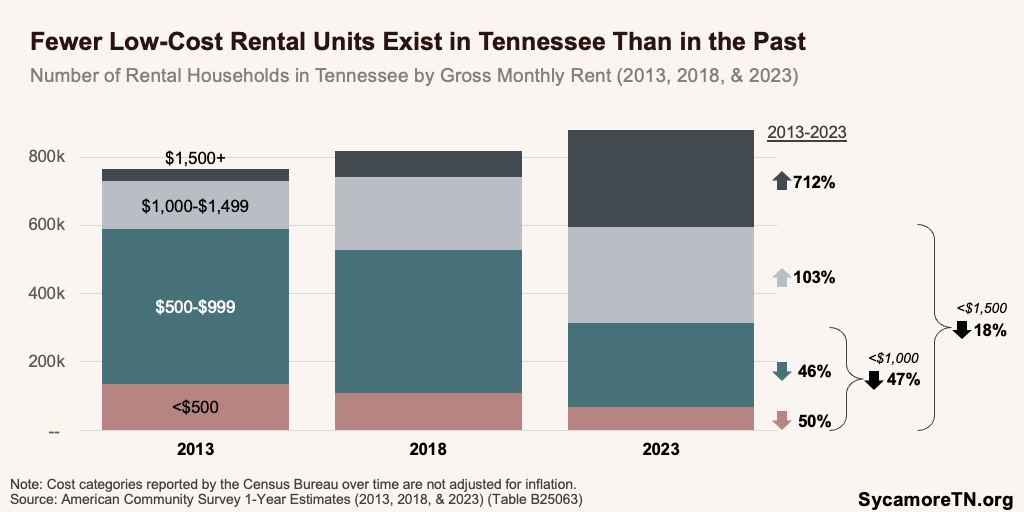
- Rent — Typical rent and typical wages among renters grew at similar rates in Tennessee between 2013 and 2023—16% and 14%, respectively, after adjusting for inflation. (27) (13) However, the number of lower-cost rentals—those below $1,000/month—fell by nearly 50% over the same period. Meanwhile, the number priced above $1,500/month grew by over 700% (Figure 14). (28)
Figure 11
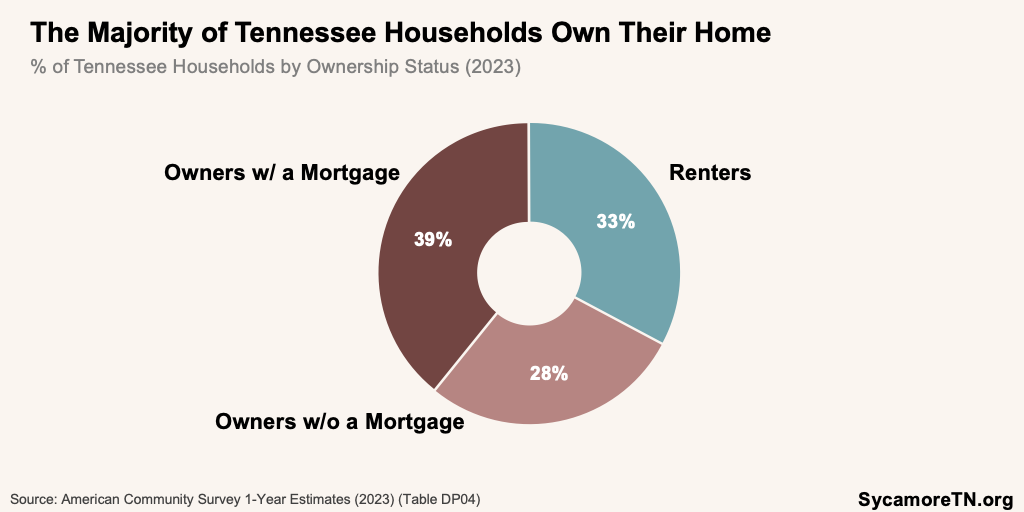
Figure 12

Figure 13
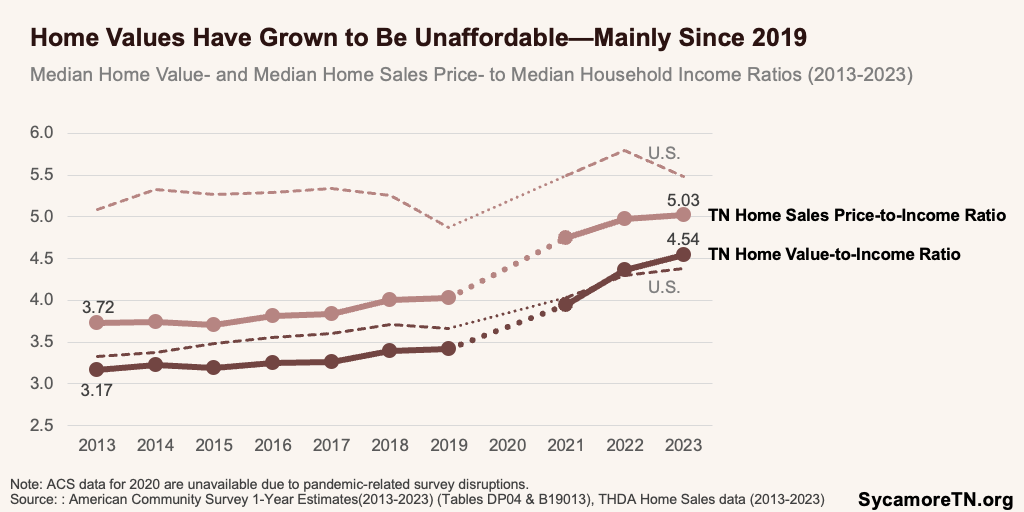
Figure 14
In 2023, about 789,000 Tennessee households (or 27%) were cost-burdened—including nearly half of renters and a quarter of homeowners with a mortgage (Figures 15 and 16). When households spend 30% or more of their income on housing—including related costs such as utilities and property taxes—they are considered “cost-burdened.” As housing becomes more expensive, Tennesseans may be sorting into housing that better fits their budgets, because the share of those cost-burdened was lower in 2023 than in 2013 for all household types except homeowners without a mortgage. Meanwhile, the number across all types of households was not statistically significantly different. (29) (30)
Figure 15
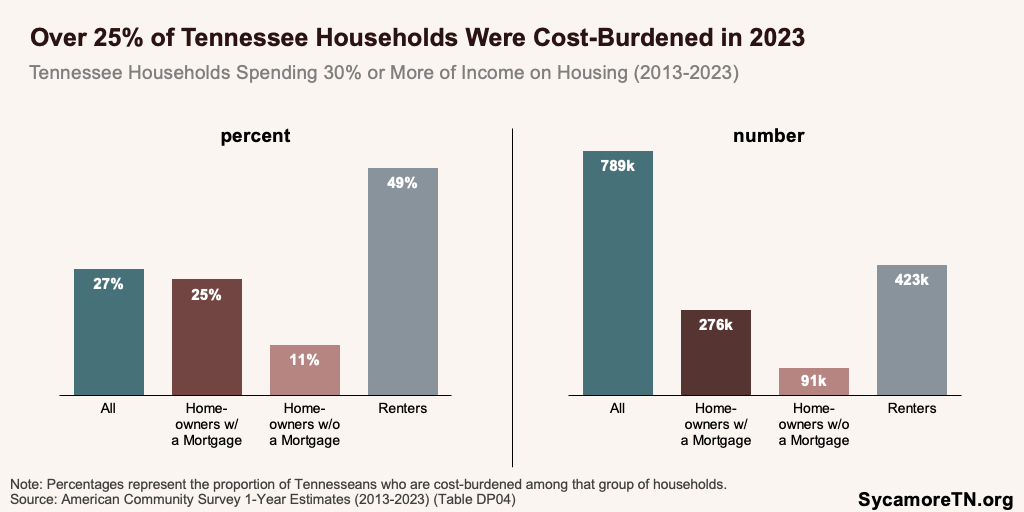
Figure 16

4. Some areas and populations in Tennessee may feel these housing challenges more than others.
The unique population trends Tennessee has experienced in recent years have created affordability challenges for areas that have not traditionally faced housing pressures. Tennessee’s more urban areas have long had more competitive housing markets with higher home price-to-income ratios. When shrinking inventories and growing populations converged, Tennessee met it with continued growth in new housing construction, mainly in urban areas. As migration to outlying counties absorbed housing stock in markets unprepared for sudden population growth, higher housing prices began to seep into increasingly rural areas in the early 2020s—particularly in Middle and East Tennessee. For example:
- Home Price Growth — Middle Tennessee counties tended to experience the highest growth in home prices between 2013 and 2023—particularly more rural ones just outside of the largest and most urban counties (Figure 17). The increase in housing prices far outpaced the growth in the typical household income during this time in nearly every county. Still, on average, these differences were larger for rural counties than urban ones—especially in Middle and East Tennessee (Figures 18 and 19).
- Price-to-Income Ratios — No matter the starting point, all of Tennessee’s 10 metro areas saw growth in the ratio between the typical home sales price and the area median income between 2013 and 2023—meaning that home ownership became increasingly out of reach for local households (Figure 20). At the county level, fewer than half of Tennessee’s 95 counties had price-to-income ratios above the 3.0 affordability threshold in 2013. By 2020, that number increased to 65 counties and swelled over the next three years—reaching all but 12 counties by 2023 (Figure 21). Over this same period, the number of rural counties above that 3.0 affordability threshold rose from 23 in 2013 to 60 in 2023.
Figure 17

Figure 18

Figure 19

Figure 20
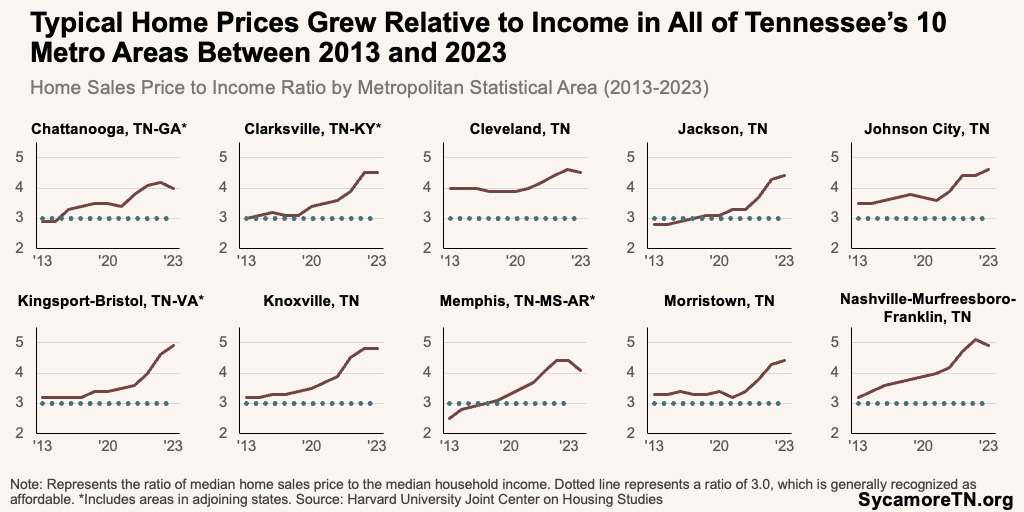
Figure 21

The shares of cost-burdened households vary significantly across the state and for populations within communities. For example:
- Geographic Differences (Figures 22-26) — Across Tennessee’s 95 counties, the share of households that were cost-burdened during 2019-2023 ranged from 33% in Davidson County to just 14% in Johnson County (Figure 22). (22) The gap between counties was widest for renters, ranging from half of renter households in Madison County to 20% in Clay (Figure 23). These differences are even starker across communities. For example, there are six Census tracts—which are smaller than zip code areas—across the state where more than 70% of all households were cost-burdened (Figure 26).
- Racial Differences (Figures 27-28) — Black, Hispanic, and white households are cost-burdened at different rates, on average. Statewide, a greater share of black households is cost-burdened than white or Hispanic households (Figure 27). (32) At the county level, there are 12 counties where over half of all black households are cost-burdened (Figure 28) and 33 where over half of black renter households are cost-burdened. By contrast, there are no counties where more than 30% of white households are cost-burdened and only one county—Sequatchie—where more than half of white renters were cost-burdened.
Figure 22

Figure 23
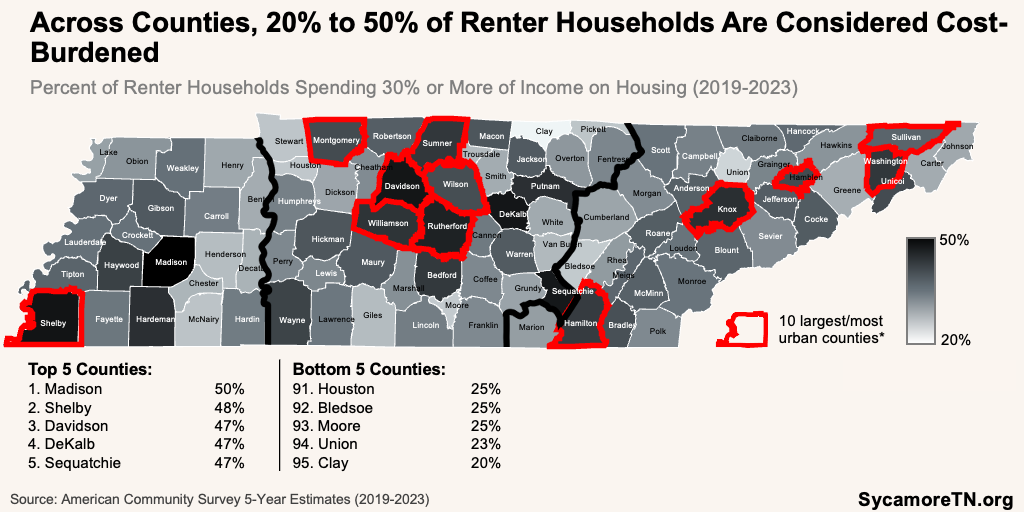
Figure 24
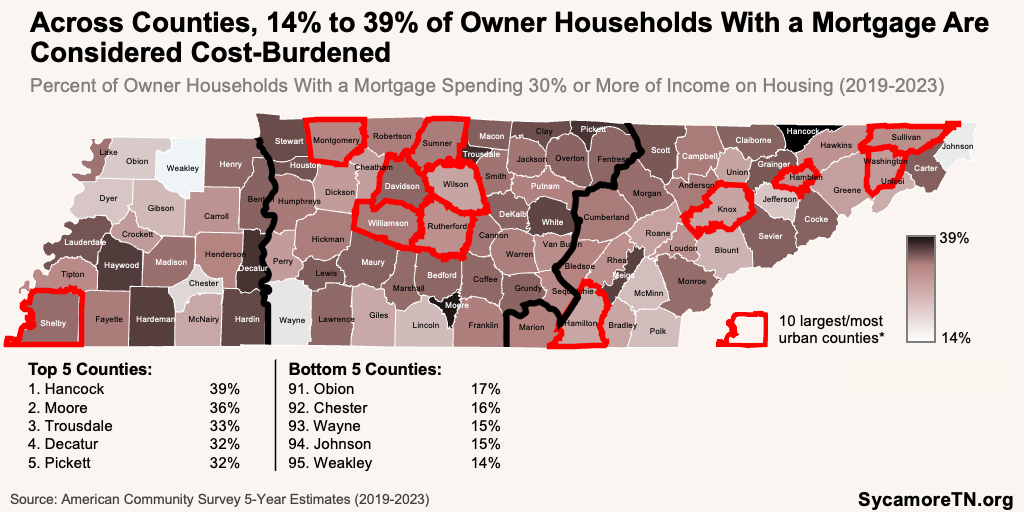
Figure 25
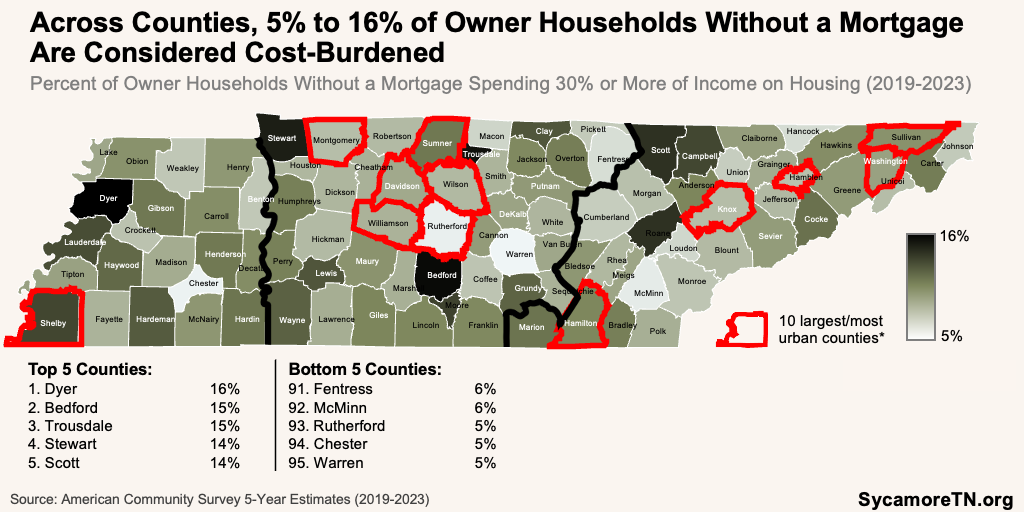
Figure 26

Figure 27

Figure 28

5. The data don’t tell the whole story.
The available data constrain detailed analysis. For example, the American Housing Survey provides detailed housing data across many areas of interest (e.g., types of housing, square footage, availability), but data are only available for limited time periods and two metro areas in Tennessee (Memphis and Nashville). Examples of other limitations include:
- Supply Data — Available data make it difficult to assess supply at the local level in a timely manner—particularly for smaller, more rural counties. For example, supply data is not state-specific from the start to finish of a project. Approved building permits are good indicators of development intent, but approved permits are not finished housing units. The Census Bureau reports completed housing units at a regional level (i.e., South, West, etc.) but not at the state level.(36) Housing experts have also critiqued vacancy rates and housing unit counts because of issues like blighted properties and vacation homes. (37) Meanwhile, the American Community Survey’s 5-year estimates for smaller counties make it difficult to make timely assessments about vacancies and supply in Tennessee’s more rural areas.
- Ambiguous Terms — Housing discussions are rife with buzzwords that don’t always have clear definitions. For example, “starter homes” and “missing middle housing” have taken housing discussions by storm, yet measuring them proves difficult. For example, a starter home is generally defined as one with three or fewer bedrooms. However, 2023 data show these homes make up nearly 80% of Tennessee housing units—hardly a statewide shortage. (38) (13) However, these data do not include fully descriptive characteristics (e.g., single-family detached, apartment, duplex). As a result, it limits our ability to flesh out the shortage of what is in demand—single-family homes.
- Areas for Further Research — The drivers of housing choice need further research because housing wants differ from housing needs.(39) (40) The data clearly show that Tennesseans have moved away from urban areas and into more rural counties, straining unprepared housing markets. (7) (12) The numbers suggest that households may be spreading out to find more affordable housing, but it may leave out other motivating factors to move from high- to low-density areas—like quieter living, the number of small businesses, or COVID-19-related reasons. (15) (41) (42)
Parting Words
Tennessee’s housing supply shortage is similar to that of other states. (43) However, it is historically unique in many ways—driven by migration into and around the state. As these trends slow and housing supply catches up, the recent rapid increase in housing costs is expected to ease—absent any unforeseen events. (44) Even as things stabilize, high housing costs are a challenging new normal, especially in communities that have not traditionally grappled with these issues. Future reports will explore policy levers to navigate these recent changes in the Tennessee housing market.
Geographic Designations
Rural/Urban Counties — The U.S. Census Bureau designates areas and counties as urban or rural. The Decennial Census counts the country’s population and designates some census tracts as urban based on housing, business, and population densities. If over 50% of a county’s population lives in urban tracts, a county is considered urban. All others are considered rural. (45) According to the 2020 Census, 23 of Tennessee’s 95 counties are considered urban, and 72 are rural (Figure 29).
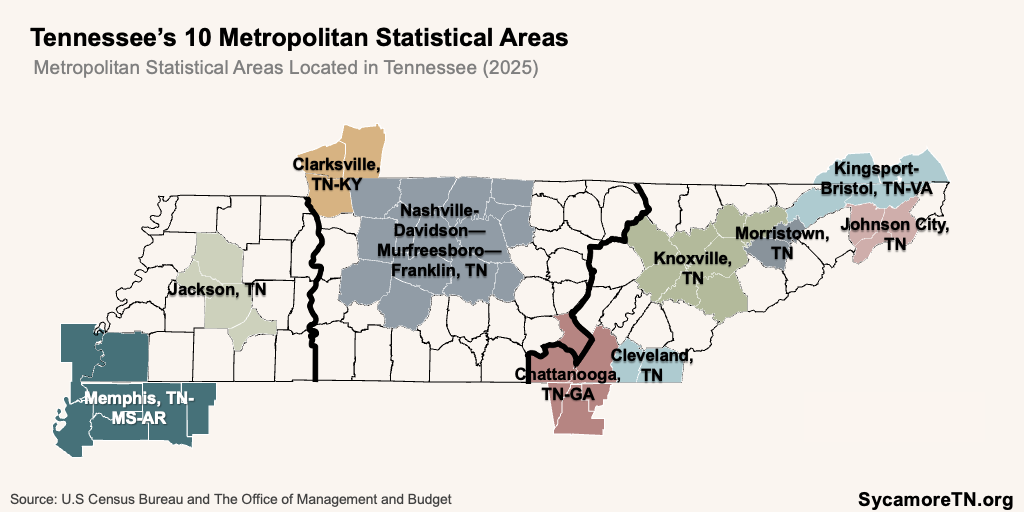
Metro Areas — The U.S. Census Bureau designates metropolitan statistical areas (MSAs). MSAs are economically and socially integrated areas containing at least one core urban area with 50,000 or more people and its surrounding communities, which can include counties in other states. (46) Tennessee has 10 MSAs (Figure 30).
Suburban Areas — The Census Bureau does not define “suburbs.” Generally, the term describes communities outside a major city but within commuting distance for work or other resources. (47)
Figure 29
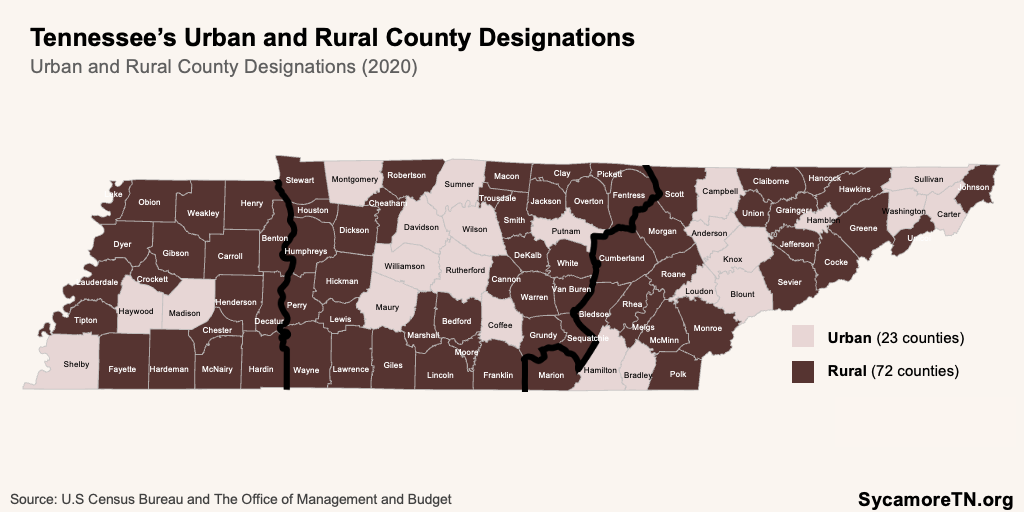
Figure 30
[1] Rental unit vacancy rates are higher than homeowner vacancy rates primarily because renters move more frequently.
References
Click to Open/Close
References
- Zillow Group. The U.S. is Now Short 4.5 Million Homes as the Housing Deficit Grows. Zillow. June 18, 2024. https://zillow.mediaroom.com/2024-06-18-The-U-S-is-now-short-4-5-million-homes-as-the-housing-deficit-grows.
- Khater, Sam, et al. The Major Challenge of Inadequate U.S Housing Supply. Freddiemac.com. Freddie Mac, December 5, 2018. https://www.freddiemac.com/research/insight/20181205-major-challenge-to-u.s.-housing-supply.
- Federal Reserve Bank of St. Louis. Economic Data, New Private Housing Units Authorized by Building Permits for Tennessee. January 27, 2025. https://fred.stlouisfed.org/series/TNBPPRIVSA#.
- II, H. Bollick. COVID’s Lasting Impacts on Construction and Real Estate Trends. Brooks, Pierce, McLendon, Humphrey & Leonard, LLP, October 8, 2020. https://www.brookspierce.com/covid-19-response-resource-center/covids-lasting-impacts-on-construction-and-real#:~:text=In%20June%2C%20the%20ACG%20found,would%20be%20late%20or%20cancelled..
- Council of Economic Advisors. The Role of Housing in Inflation. Biden White House Archives. The White House, September 11, 2024. https://bidenwhitehouse.archives.gov/cea/written-materials/2024/09/11/the-role-of-housing-in-u-s-inflation/.
- Emmons, William. Construction Costs, Not Another Housing Bubble, Are Driving House Prices Higher. On the Economy. Federal Reserve Bank of St. Louis, September 05, 2019. https://www.stlouisfed.org/on-the-economy/2019/september/construction-costs-housing-bubble-driving-housing-prices-higher.
- Meeker, Rebecca and Mota, Nuno. COVID-19’s Impact on Housing Demand in High-Density Areas – Evidence from Purchase Mortgage Applications. Fannie Mae . March 2021. https://www.fanniemae.com/media/38866/display.
- Joint Center for Housing Studies of Harvard University. Price To Income Map. 2024. https://www.jchs.harvard.edu/son-2024-price-to-income-map.
- U.S. Census Bureau. County Total Population Estimates, Components of Change, 2010-2020. November 7, 2024. https://www2.census.gov/programs-surveys/popest/datasets/.
- —. County Total Population Estimates, Components of Change, 2020-2023. May 16, 2024. https://www2.census.gov/programs-surveys/popest/datasets/.
- U.S. Census Bureau. Urban and Rural: County-level 2020 Census Urban and Rural Information for the U.S., Puerto Rico, and Island Areas sorted by state and county FIPS codes. September 2023. [Cited: December 12, 2024.] https://www.census.gov/programs-surveys/geography/guidance/geo-areas/urban-rural.html.
- Internal Revenue Service. SOI Tax Stats – Migration Data (2021-2022). July 29, 2024. https://www.irs.gov/statistics/soi-tax-stats-migration-data.
- U.S. Census Bureau. Selected Housing Characteristics, American Community Survey 1-Year Estimates (Table DP04). [Online] 2024. https://data.census.gov/table/ACSDP1Y2023.DP04?q=DP04&g=010XX00US_040XX00US47.
- Federal Reserve Bank of St. Louis. Housing Inventory: Median Listing Price (MEDLISPRI {47189, 47187, 47165, 47163, 47157, 47149, 47125, 47093, 47065, 47037, 6073, 6059, 17031, 6037}). January 7, 2025. https://fred.stlouisfed.org/series/MEDLISPRI6037.
- Whitaker, Stephan. Did the COVID-19 Pandemic Cause an Urban Exodus? Federal Reserve Bank of Cleaveland. February 5, 2021. https://www.clevelandfed.org/publications/cleveland-fed-district-data-brief/cfddb-20210205-did-the-covid-19-pandemic-cause-an-urban-exodus.
- Federal Reserve Bank of St. Louis. The Great Recession and Its Aftermath. Federal Reserve History. November 22, 2013. https://www.federalreservehistory.org/essays/great-recession-and-its-aftermath.
- Redfin National Real Estate Brokerage. Data Center. Downloadable Data. January 2025. https://www.redfin.com/news/data-center/.
- U.S. Census Bureau. Building Permits Survey, Permits by CBSA. 2024. https://www.census.gov/construction/bps/msamonthly.html.
- Tennessee Housing Development Agency. Home Sales: New and Existing Homes. Tennessee Housing Development Agency. January 2025. https://thda.org/research-reports/tennessee-housing-market/tennessee-home-sales-data.
- Weinstock, Lida R. U.S Housing Supply: Recent Trends and Policy Considerations. Congressional Research Service. Congressional Research Service, 7 2023, July. https://crsreports.congress.gov/product/pdf/R/R47617.
- Dunn, Meredith. Inventory and Months Supply. National Association of Realtors – Economists’ Outlook. National Association of Realtors, January 22, 2021. https://www.nar.realtor/blogs/economists-outlook/inventory-and-months-supply.
- U.S. Census Bureau. Selected Housing Characteristics, American Community Survey 5-year Estimates (Table DP04). 2024. https://data.census.gov/table/ACSDP5Y2023.DP04?q=DP04&g=040XX00US47&moe=true.
- Calef, Anne, et al. The Greater Boston Housing Report Card. University of Boston, October 2022. https://www.tbf.org/-/media/tbf/reports-and-covers/2022/october/part-1-from-gbhrc2022_interactive_web.pdf.
- Stevenson, Mary Huff. The Urban Experience: Economics, Society, and Public Policy. New York : Oxford University Press, 2008.
- Mortgage News Daily. Home Vacancy rate. 2025. https://www.mortgagenewsdaily.com/data/home-vacancy.
- Cox, Wendell. Demographia International Housing Affordibility, 2024 Edition. Center for Demographics and Policy, Chapman University. https://www.demographia.com/dhi.pdf.
- U.S. Census Bureau. Median Household Income in the Past 12 Months, American Community Survey 1-Year Estimates Detailed Tables, Table B19013. 2024. https://data.census.gov/table/ACSDT1Y2023.B19013?q=B19013:%20Median%20Household%20Income%20in%20the%20Past%2012%20Months%20(in%202023%20Inflation-Adjusted%20Dollars).
- —. Gross Rent, American Community Survey 1-year Estimate Detailed Table B25063. 2025. https://data.census.gov/table/ACSDT1Y2013.B25063?q=Gross%20rent&g=040XX00US47.
- —. Gross Rent as a Percentage of Household Income in the Past 12 Months, American Community Survey 5-Year Estimates Detailed Tables, Table B25070. 2024. https://data.census.gov/table/ACSDT5Y2023.B25070.
- —. Mortgage Status by Selected Monthly Owner Costs as a Percentage of Household Income in the Past 12 Months. American Community Survey, ACS 5-Year Estimates Selected Population Detailed Tables, Table B25091. 2024. https://data.census.gov/table?q=B25091:%20Mortgage%20Status%20by%20Selected%20Monthly%20Owner%20Costs%20as%20a%20Percentage%20of%20Household%20Income%20in%20the%20Past%2012%20Months&t=-03&g=040XX00US47.
- —. Median household income in the past 12 months, American Community Survey 1-Year Estimates Detailed Tables, Table B19013. 2024. https://data.census.gov/table/ACSDT1Y2023.B19013?q=B19013:+Median+Household+Income+in+the+Past+12+Months+(in+2023+Inflation-Adjusted+Dollars)&g=040XX00US47.
- —. ACS 5-year data, B251040B/H/I Housing Costs as a Percentage of Household Income in the Past 12 Months . 2025. https://data.census.gov/table?q=B25140B&g=040XX00US47.
- Ross, Wilbur, et al. Understanding and Using American Community Survey Data, What All Data Users Need to Know. September 2020. https://www.census.gov/content/dam/Census/library/publications/2020/acs/acs_general_handbook_2020.pdf.
- Bureau of Labor Statistics. Consumer Price Index, R-CPI-U-RS Homepage. March 26, 2024. https://www.bls.gov/cpi/research-series/r-cpi-u-rs-home.htm.
- U.S. Census Bureau. Small Area Income and Poverty Estimates (SAIPE). 2025. https://www.census.gov/data-tools/demo/saipe/#/?s_state=47&s_county=47001,47003,47005,47007,47009,47011,47013,47015,47017,47019,47021,47023,47025,47027,47029,47031,47033,47035,47037,47039,47041,47043,47045,47047,47049,47051,47053,47055,47057,47059,47061,4.
- —. New Residential Contstruction data, Historical Time Series, Housing Units Completed. February 19, 2025. https://www.census.gov/construction/nrc/data/series.html.
- —. HVS Definitions and Explanations. February 5, 2025. https://www.census.gov/housing/hvs/definitions.pdf.
- Jones, Jonathan. The Best U.S. Cities to Find a Starter Home. Construction Coverage. June 29, 2024. https://constructioncoverage.com/research/best-cities-to-find-a-starter-home.
- Di, Zhu, Yang, Yi and Liu, Xiaodong. The Importance of Housing To the Accumulation of Household Net Wealth. Joint Center for Housing Studies, Harvard. November 2003. https://www.jchs.harvard.edu/sites/default/files/w03-5_di.pdf.
- Goodman, Laurie and Zhu, Jun. The Future of Headship and Homeownership. The Urban Instititute . January 2021. https://www.urban.org/sites/default/files/publication/103501/the-future-of-headship-and-homeownership.pdf.
- Stobbe, Emil, Forlim, Caroline and Kuhn, Simone. Impact of exposure to natural versus urban soundscapes on brain functional connectivity, BOLD entropy and behavior. Environmental Research. ScienceDirect, March 1, 2024. https://www.sciencedirect.com/science/article/pii/S0013935123025926.
- Gilani, Towseef and Mir, Mohammad. A study on the assessment of traffic noise induced annoyance and awareness levels about the potential health effects among residents living around a noise-sensitive area. National Library of Medicine. July 3, 2021. https://pmc.ncbi.nlm.nih.gov/articles/PMC8254638/.
- Joint Center for Housing Studies of Harvard University. The State of the Nation’s Housing 2024. https://www.jchs.harvard.edu/sites/default/files/interactive-item/files/Harvard_JCHS_State_of_the_Nations_Housing_2024_Key_Facts.pdf.
- Boyd Center for Business and Economic Research. An Economic Report to the Governor of Tennessee. University of Tennessee, December 19, 2024. https://haslam.utk.edu/publication/economic-report-to-the-governor-2025/.
- U.S. Census Bureau. Urban and Rural. September 2023. https://www.census.gov/programs-surveys/geography/guidance/geo-areas/urban-rural.html.
- —. [Online] July 25, 2023. https://www.census.gov/programs-surveys/metro-micro/about.html.
- Airgood-Obrycki, Whitney and Reiger, Shannon. Defining Suburbs: How Definitions Shape the Suburban Landscape. Joint Center for Housing Studies of Harvard University. February 2019. https://www.jchs.harvard.edu/sites/default/files/Harvard_JCHS_Airgood-Obrycki_Rieger_Defining_Suburbs.pdf.
- Boyd Center for Business and Economic Research. New Metropolitan and Micropolitan Area Boundaries Include Changes for Eight Tennessee Counties. The University of Tennessee Knoxville, August 21, 2023. https://tnsdc.utk.edu/2023/08/21/new-metropolitan-and-micropolitan-area-boundaries-include-changes-for-eight-tennessee-counties/.
