

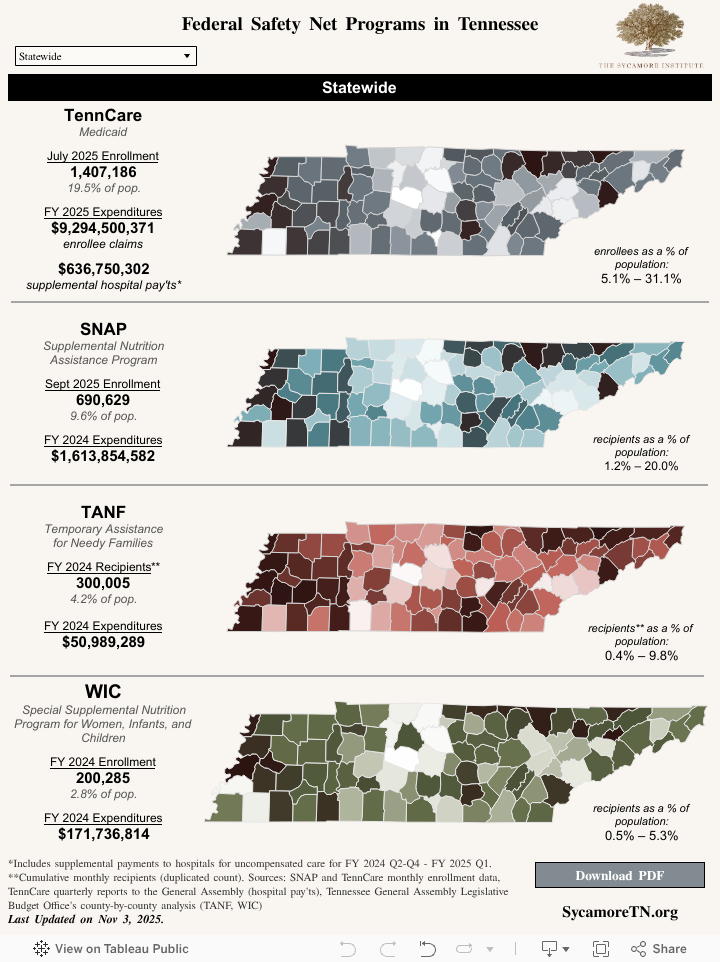
Congress is considering changes to a number of safety net programs that the state and federal governments jointly fund and/or administer. To help state policymakers and Tennesseans better understand the scale of these programs in their communities, we compiled the most recent county-level data on enrollment and total expenditures for several key public assistance programs.
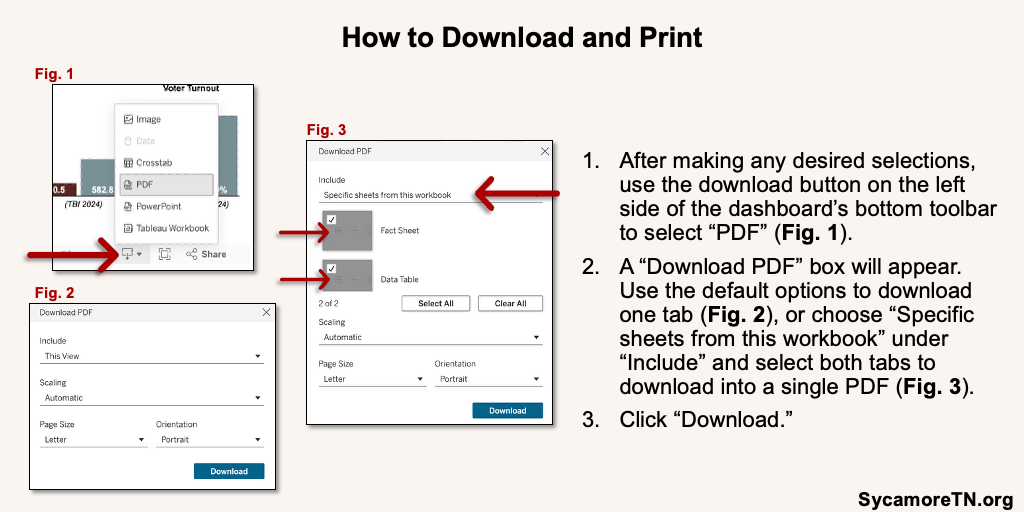
Use the dashboard below to explore the number of individuals receiving benefits and total payments by county for the most recent period available. After filtering by county, click the “Download PDF” button for a printable one-pager.
References
Click to Open/Close
References
- TennCare. Enrollment Data (March 2025). 2025. https://www.tn.gov/tenncare/information-statistics/enrollment-data.html
- TennCare. Report to Legislative Committees (Oct-Dec 2023 through Jul-Sept 2024). 2023-2024. https://www.tn.gov/tenncare/information-statistics/report-to-legislative-committees.html.
- Tennessee Department of Human Services. SNAP Statistical Information (March 2025). 2025. https://www.tn.gov/humanservices/for-families/supplemental-nutrition-assistance-program-snap/snap-statistical-information.html.
- Tennessee General Assembly Office of Legislative Budget Analysis. FY 2024 County-by-County Analysis. 2025. https://wapp.capitol.tn.gov/apps/countyanalysis.
- U.S. Census Bureau. Annual Estimates of the Resident Population for Counties: April 1, 2020 to July 1, 2024 (CO-EST2024-POP). 2025. https://www.census.gov/data/tables/time-series/demo/popest/2020s-counties-total.html.
