Along with our environments and behaviors, access to health care is one of the major drivers of health. For better or worse, robust access to the U.S. health care system is largely predicated on having health insurance.
Using nine years of Tennessee data from multiple sources, this report provides a comprehensive picture of recent trends in health insurance coverage, private plan choice and costs, and the uninsured in our state.
Key Takeaways
Sources of Coverage:
- 90% of Tennesseans had health insurance in 2018, with just over half the population getting job-based coverage through an employer.
Job-Based Coverage:
- Most Tennessee workers are offered job-based health insurance, typically with at least two plan options.
- Employers cover the majority of job-based health premiums, but the employee share has grown over time. Today, Tennesseans with job-based coverage pay much higher premiums and deductibles than in 2010.
Healthcare.gov Marketplace Coverage:
- Marketplace plans are a relatively small source of coverage in Tennessee (3% in 2018). Enrollment peaked in 2016 and has slowly declined each year since.
- Every area of Tennessee had at least six plan options in 2020. There are large differences in the average cost of coverage for people in different areas and those with or without subsidies.
The Uninsured:
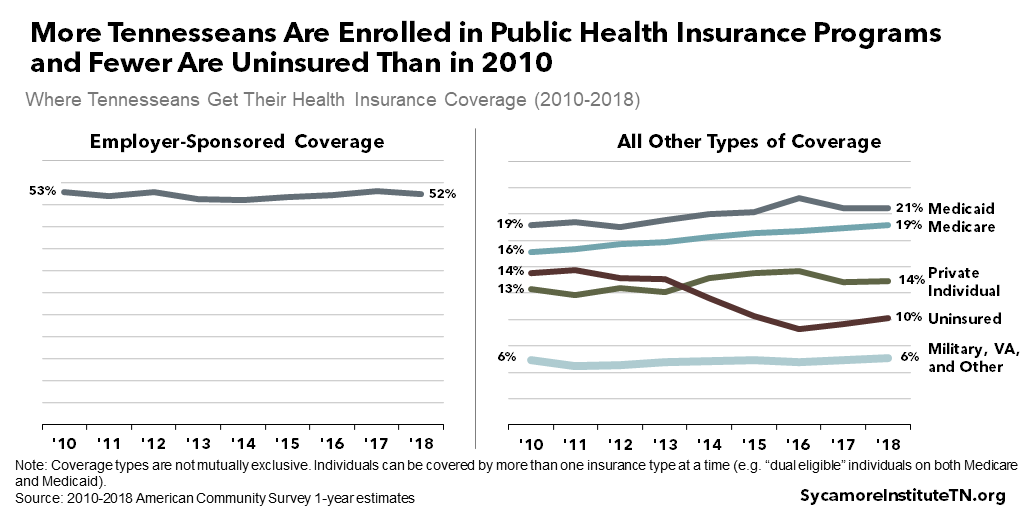
- 10% of Tennesseans did not have health insurance in 2018. The uninsured rate has fallen over the last decade but ticked back up since reaching a low of 9% in 2016.
- Men, people of color, younger adults, the unemployed, and those with less education and income are more likely to be uninsured.
Sources of Coverage in Tennessee
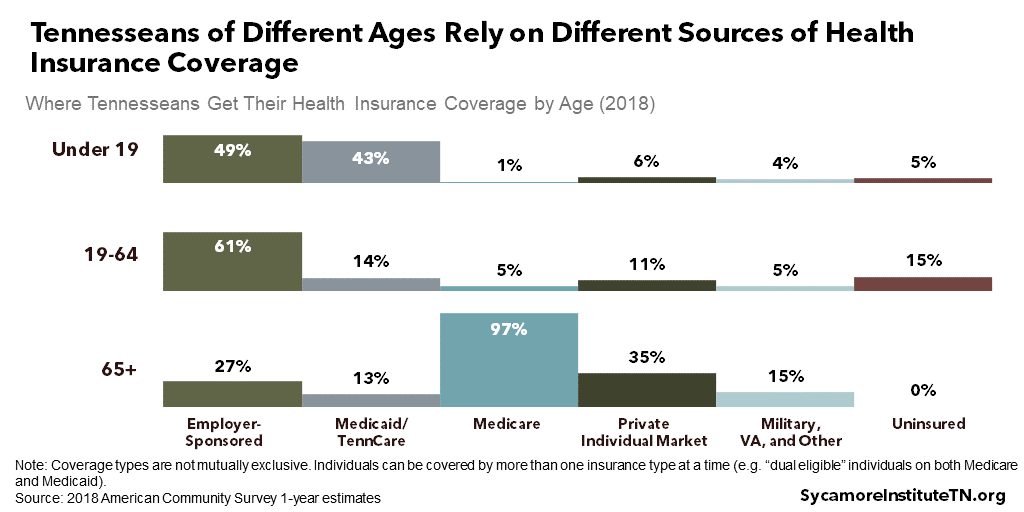
In 2018, 90% of Tennesseans had health insurance, and the majority of those individuals had private coverage through an employer (Figure 1). The second largest coverage group was TennCare (the state’s Medicaid program), where more than one in five received coverage — a rate that varies across the state. Different age groups, however, rely on each source of coverage to varying degrees (Figure 2):
- Children Under 19: Nearly half of children in Tennessee are covered by private job-based plans, while 43% are on TennCare. To be eligible for TennCare, children must live in a household with an income under 250% of poverty — the highest threshold of any eligibility group.
- Non-Elderly Adults 19-64: Over 60% of non-elderly adults receive private coverage from an employer. They are also more likely to be uninsured than other age groups.
- Adults 65 and Older: Nearly all seniors are enrolled in Medicare, the federally-run health insurance program for people 65 and over. Most seniors also have some other form of insurance to pay for costs not covered by Medicare, such as private plans from a former employer or the individual Medicare supplement (or Medigap) market.
Figure 1
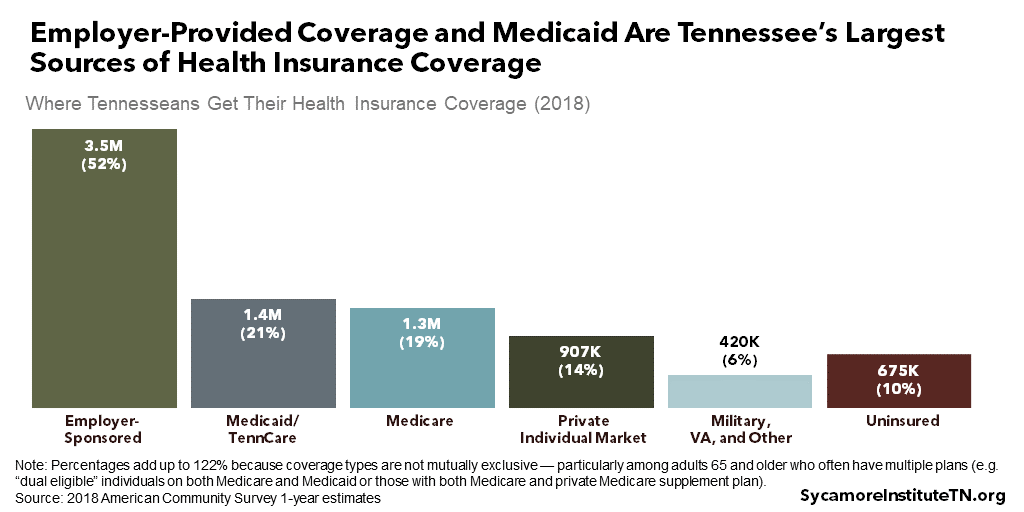
Figure 2
Tennesseans’ sources of coverage have not changed dramatically over the last decade outside of fluctuations in the uninsured rate (Figure 3). Employer-sponsored plans have consistently been the largest source of coverage for Tennesseans. Enrollment in public health insurance programs (i.e. Medicare and Medicaid/TennCare) has grown some — largely due to the aging of the population. Enrollment in private individual health insurance market plans grew some after the implementation of the Affordable Care Act (ACA) in 2014 (see below) but has leveled off since 2017.
Figure 3
Private Insurance Regulation in Tennessee
Most private health insurance in Tennessee is regulated by the state and/or federal governments, but some individual market plans are not subject to regulation.
- Federal Regulation Only: Most employer plans are “self-insured” and regulated exclusively by the federal government. About 61% of workers nationally with job-based coverage are in self-insured plans.(2) Under a self-insured plan, the employer — not the insurance company — takes on the financial risk of providing health benefits. (3) Although these plans are self-insured, they are often administered by private health insurance companies.
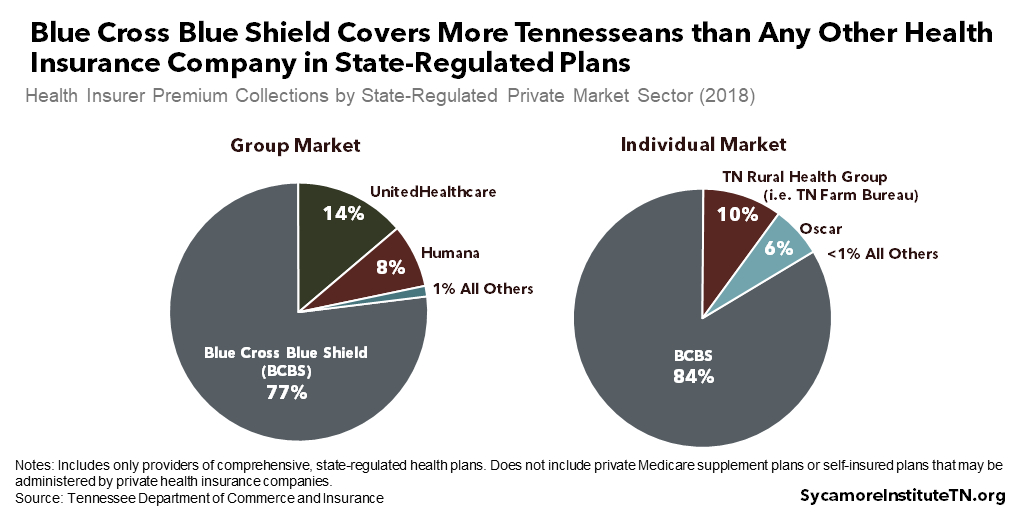
- Joint State and Federal Regulation: The state and federal governments share responsibility for setting and enforcing the rules for all other types of private insurance. In 2018, Blue Cross Blue Shield covered more Tennesseans than any other private insurer in these markets (Figure 4). (4) (5)
Federal law sets the floor for state regulation. For example, the ACA put in place private individual market health insurance rules governing everything from annual reviews of premium changes to what plans must cover. (3) Tennessee’s Department of Commerce and Insurance (TDCI) is responsible for ensuring that plans in Tennessee meet federal requirements and carrying out any state requirements (e.g. licensing insurers, monitoring their financial stability).
- Unregulated Plans: Plans offered by the Tennessee Farm Bureau are specifically exempt from health insurance regulation in Tennessee law. (6) As a result, they are regulated by neither the state nor federal governments, but they reportedly voluntarily comply with some rules that apply to regulated plans. (7) (8) Farm Bureau plans were the 2nd largest insurer in Tennessee’s private individual health insurance market in 2018 (Figure 4). (4)
Figure 4
Job-Based Coverage in Tennessee
Historically, employer-sponsored insurance has been the dominant source of health coverage in Tennessee and nationally — primarily because it is subsidized by the federal government. Unlike wages, employer contributions to health insurance are exempt from income and payroll taxes. It is the federal government’s largest tax expenditure (e.g. exemption, deduction, etc.) and represented $280 billion in projected forgone federal revenues nationally in 2018. (9) (10) Employer-sponsored insurance is also a relatively effective way to pool risk for more affordable, accessible premiums.
Most Tennessee workers are offered job-based health coverage (Figure 5). In 2018, about 87% of private-sector Tennessee workers were at firms that offered health insurance — a share that has remained relatively stable over the last decade. Insurance offerings are nearly universal among firms with more than 50 employees, but coverage has become less common among smaller employers since 2010. (11)
Job-Based Plan Choice
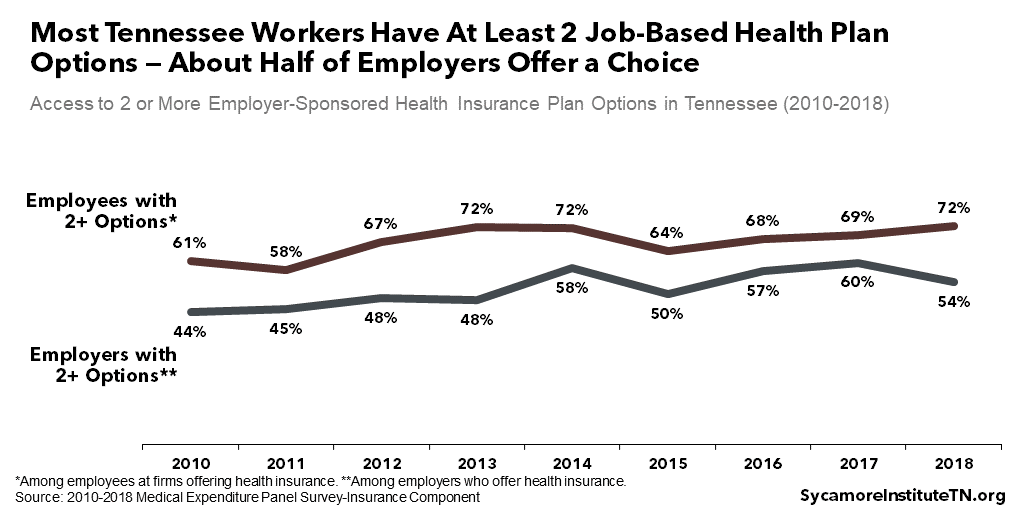
Most Tennessee workers have at least two health plan options from their employer (Figure 6). In 2018, about 72% of employees who were offered coverage had two or more plan options — a proportion that has grown over the last four years. These individuals were concentrated at larger employers. Nearly half of employers that offered coverage (mostly smaller ones) only offered one plan. (11)
Figure 5
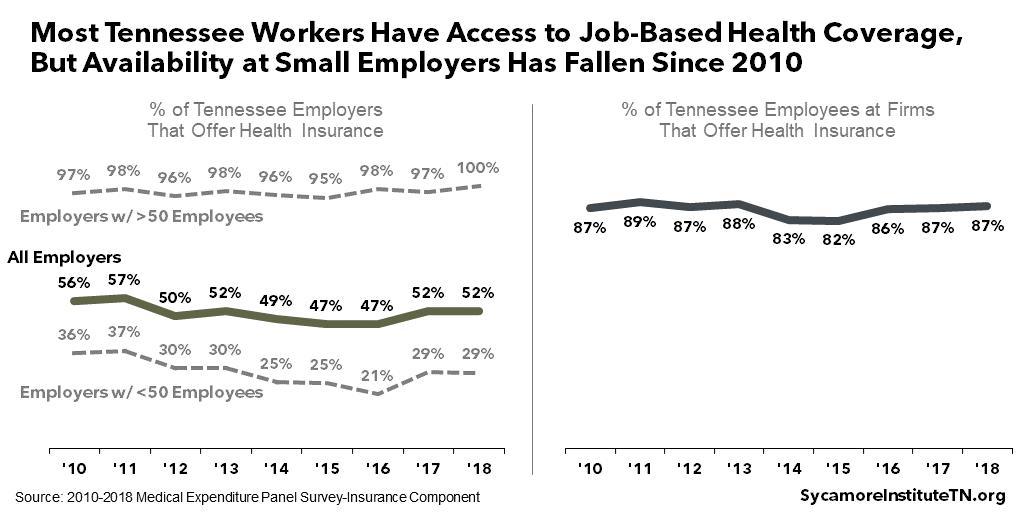
Figure 6
Job-Based Plan Costs
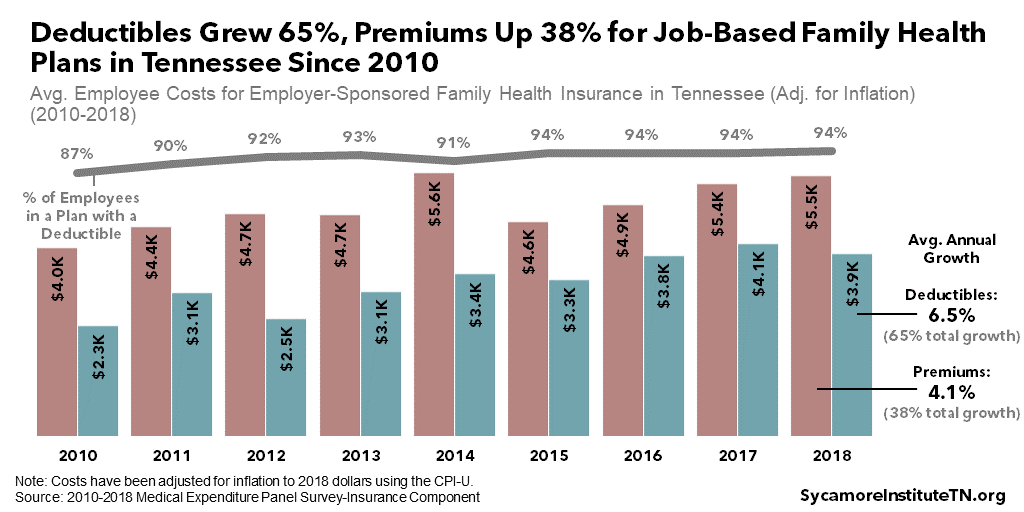
Employers cover the majority of job-based health premiums, but the employee share has grown over time (Figure 7). In 2018, employers covered, on average, 76% of individual coverage premiums and 69% of family premiums — down from 80% and 73% in 2010, respectively. (11)
Today, Tennesseans with job-based coverage pay much higher premiums and deductibles than in 2010. In 2018, the average employee paid $1,400 a year for an individual plan and had a $2,200 annual deductible — a 26% increase for premiums and 82% for deductibles since 2010 after adjusting for inflation (Figure 8). A family plan cost about $5,500 with a $3,900 deductible — increases of 38% and 65%, respectively, over 2010 (Figure 9). (11)
Figure 7
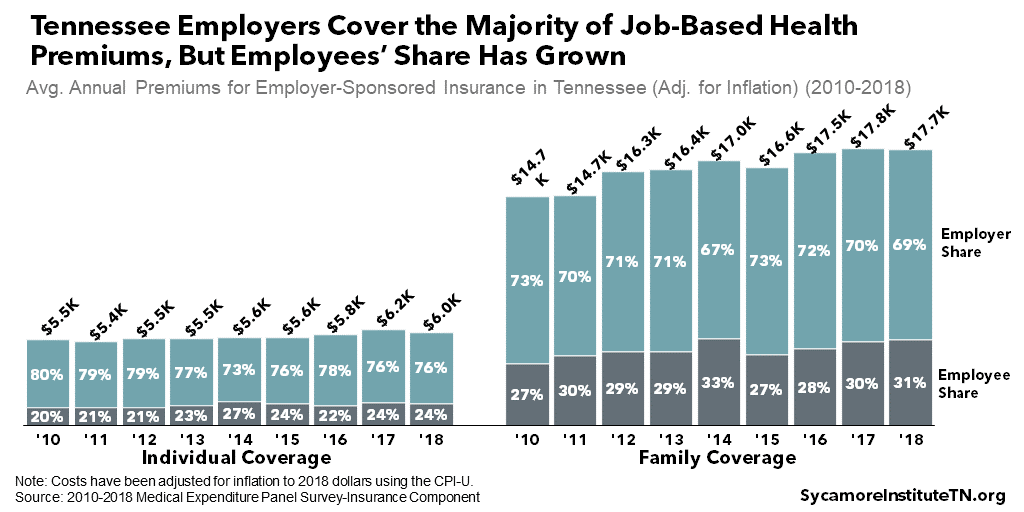
Figure 8
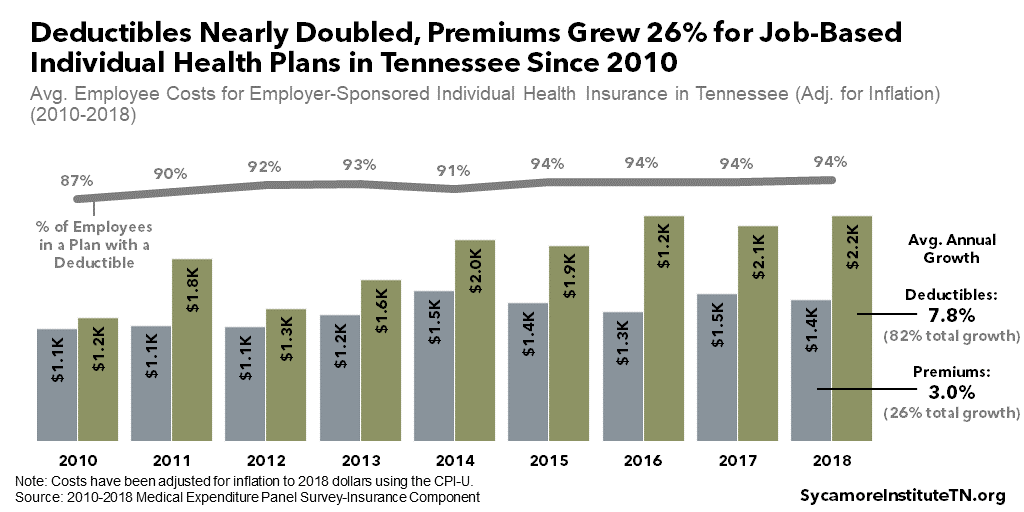
Figure 9
Research suggests that total out-of-pocket spending for job-based coverage may be quite large. According to a study of 2016-2017 data, half of Tennesseans with employer-sponsored insurance reported paying at least $4,000 a year out of pocket for premiums and cost-sharing together and 10% spent at least $11,900 (Figure 10). (12) For context, $4,000 represents about 8% of the median household income in Tennessee in 2017. (1)
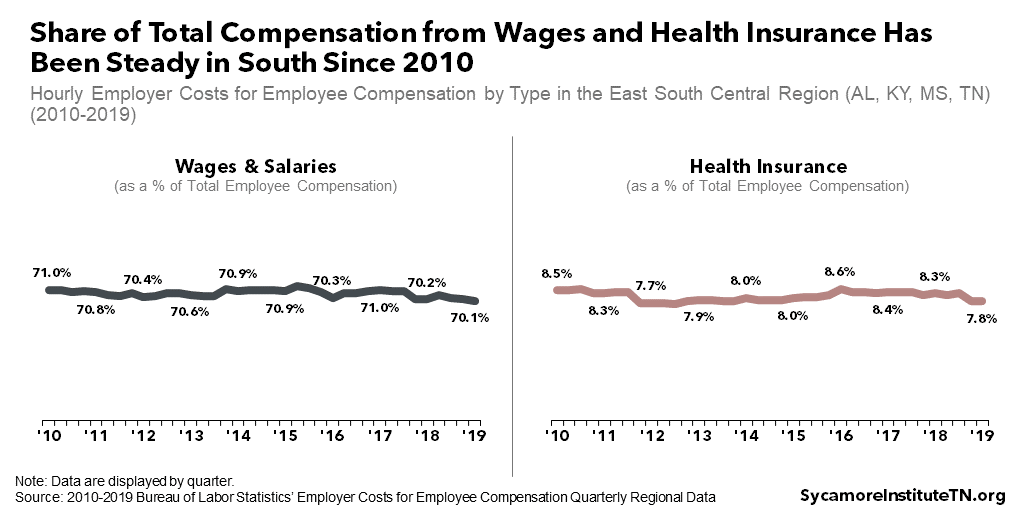
Despite the growth of insurance costs, both wages and health insurance have been a steady share of employees’ total compensation since 2010 (Figure 11). As of March 2019, cash compensation represented about 70% of employee compensation at businesses in Tennessee, Alabama, Kentucky, and Mississippi — compared with 71% in March of 2010. Health insurance dropped slightly from 8.5% in 2010 to 7.8% in 2019. (13) (14) (15) (16) (17) (18) (19) (20) (21)
Together, the data above suggest that, rather than reduce wages, employers have offset their rising health insurance costs by requiring workers to pay higher deductibles and a larger share of premiums.
Figure 10
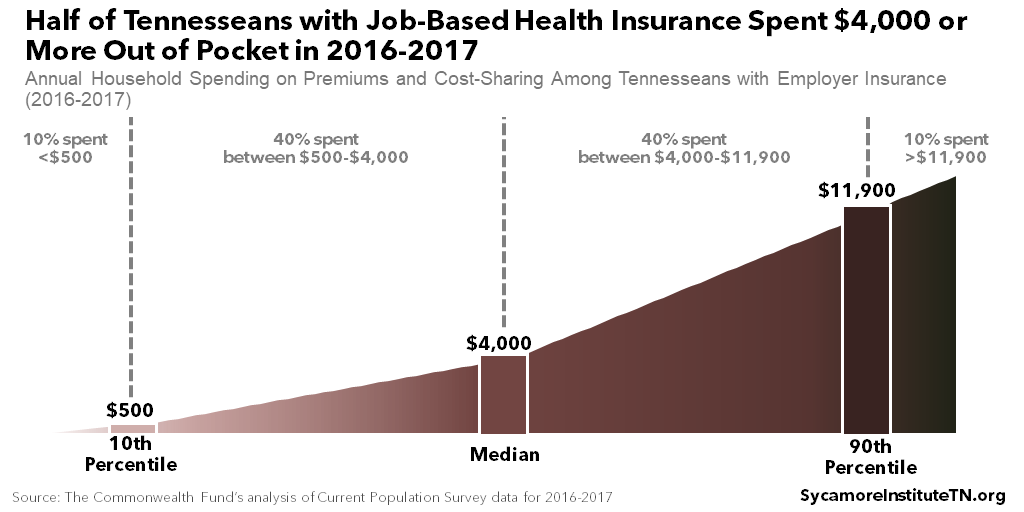
Figure 11
Tennessee’s Healthcare.Gov Marketplace
Healthcare.gov Marketplace coverage includes private individual market plans that comply with ACA rules and are federally-subsidized for enrollees under 400% of poverty. The individual market includes private plans not offered through employer group coverage. With some narrow exceptions, the ACA requires individual market plans to cover a specific set of benefits, accept all who apply, and only vary premiums based on age, smoking status, and family size. It also funds federal subsidies that reduce premiums and cost-sharing for qualified individuals who purchase plans through the Healthcare.gov Marketplace. These federal subsidies amounted to a projected $53 billion nationally in 2019. (10)
Before the ACA took effect in 2014, rules for the private individual market were set almost exclusively by states. In Tennessee, these plans could offer a narrower set of benefits, deny or limit coverage for people with pre-existing health conditions, and set premiums based on health status. As a result, the ACA made individual market plans more expensive for healthier enrollees, who may prefer less comprehensive options. The trade-off was that plans became more accessible and affordable for enrollees with greater health care needs, who prefer comprehensive plans.
Since 2014, the Marketplace has faced growing pains and numerous federal changes that affected choice, costs, and enrollment. For example, in the first several years, Tennessee insurers took heavy losses that led them to drop out of the Marketplace or significantly raise their prices. The federal government also rolled back three significant ACA elements:
- A temporary risk corridors program intended to help offset the financial risk of offering Marketplace plans in the early years was never fully funded.
- Cost-sharing reduction (CSR) payments meant to reimburse insurers for mandated limits on certain enrollees’ deductibles and co-pays ended in 2017 after the Trump administration determined the law had not properly funded them.
- The federal government eliminated the financial penalty for going without health insurance (i.e. the individual mandate) beginning in 2019.
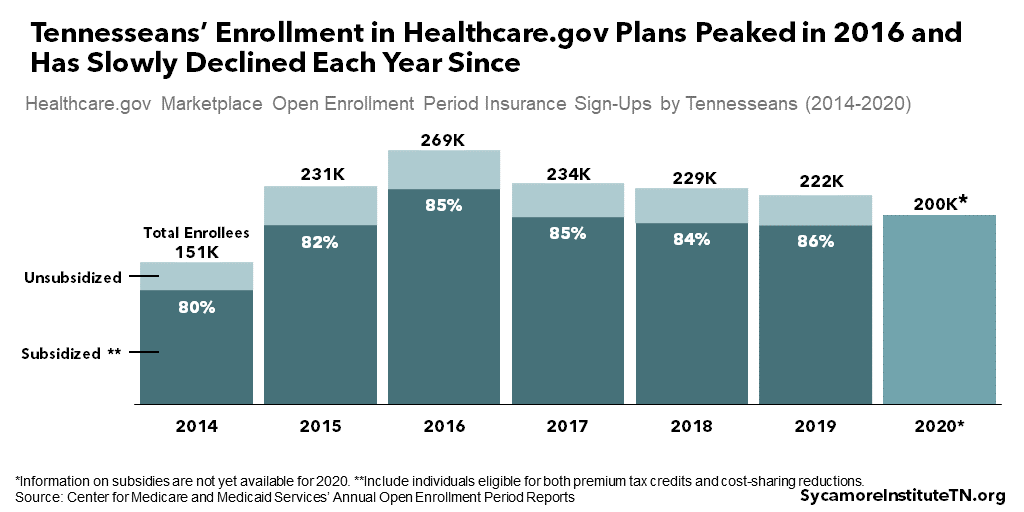
Tennesseans’ enrollment in Marketplace plans peaked in 2016 at nearly 270,000 and has slowly declined each year since (Figure 12). (29) (30) (31) (32) (33) (34) (35) Marketplace plans represent a relatively small proportion of health insurance coverage in Tennessee. In 2018, for example, these plans covered 3% of all Tennesseans and represented roughly 40% of private individual market coverage for non-elderly Tennesseans. (1) (26)
Figure 12
Marketplace Plan Choice
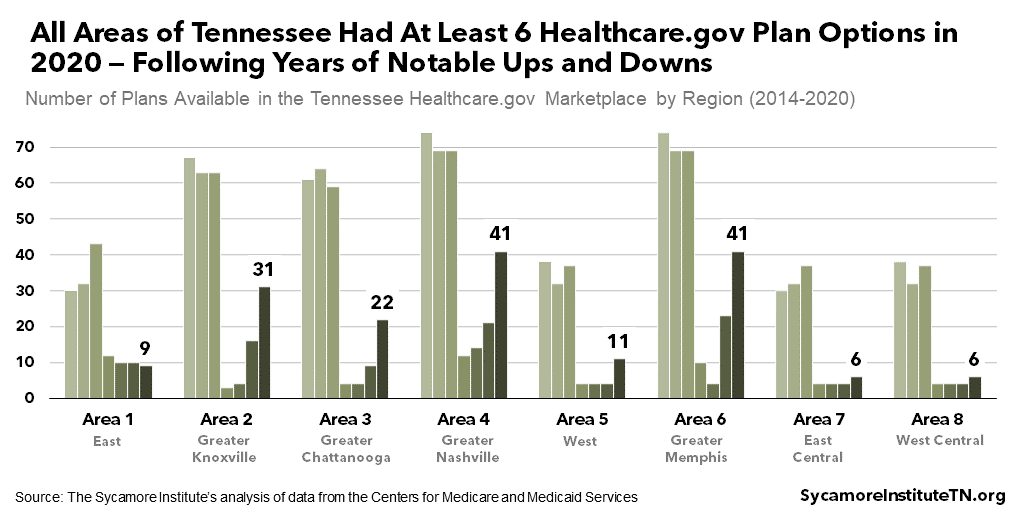
Plan choice in Tennessee’s Marketplace has been volatile since 2014 (Figure 14). In 2020, every area of Tennessee had at least six plan options — with some areas having more than 40. At the lowest point in 2017, the Greater Knoxville area had only three plan options. (29) (30) (31) (32) (33) (34) (35)
Figure 13
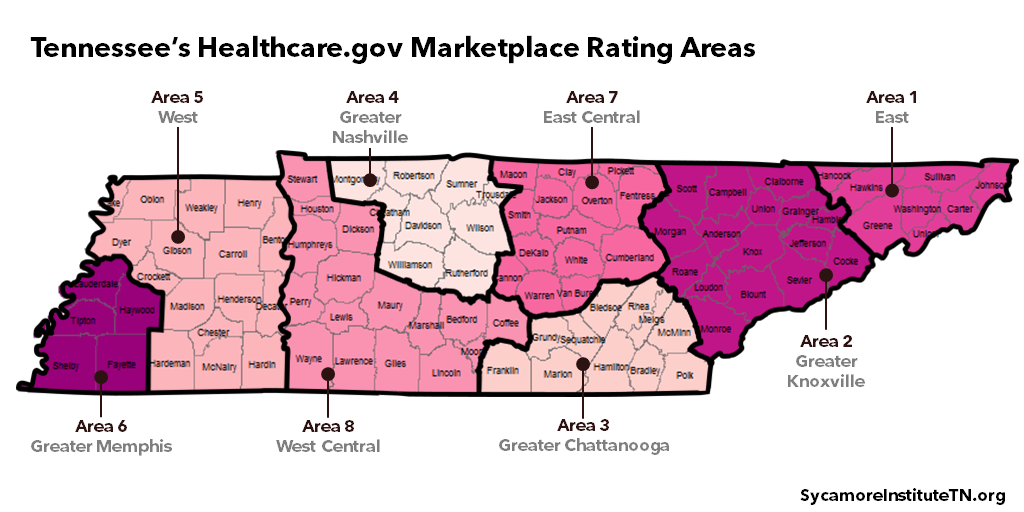
Figure 14
Marketplace Plan Costs
Premiums for Marketplace plans in Tennessee increased sharply in 2017 and then leveled off (Figure 15). In 2017, the average monthly premium across all enrollees after subsidies was 30% more expensive than in the prior year and over 50% higher than in the Marketplace’s first year after adjusting for inflation. Likely because of the rising costs in 2017 and changes to the individual mandate, Marketplace enrollment became more concentrated among people eligible for subsidies. Since 2017, however, premiums have largely stabilized. (36) (23) (37) (25) (26) (27)
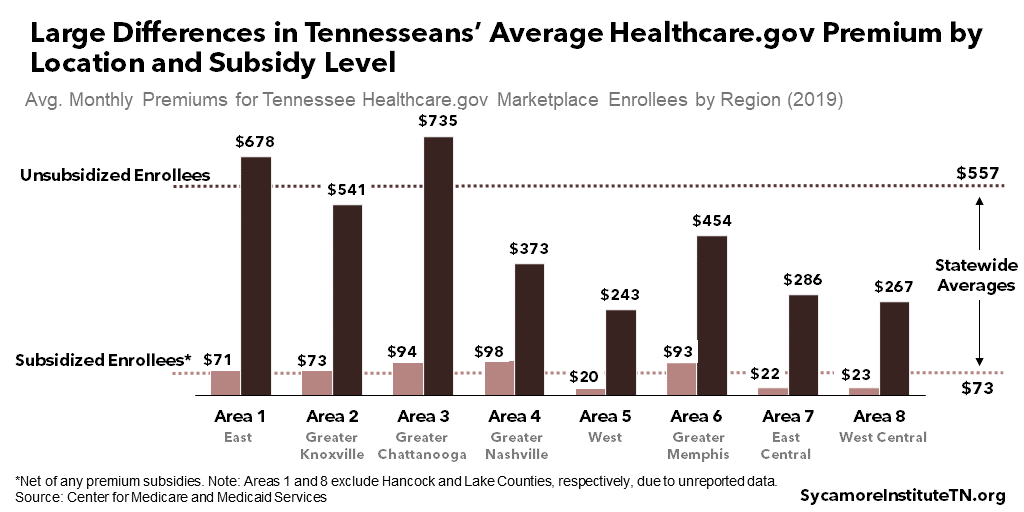
There are large differences in the average cost of coverage for people in different areas and those with or without subsidies (Figure 16). Statewide, people without subsidies paid almost eight times as much per month as people with subsidies ($557 vs. $73). Among subsidized enrollees, those in the Greater Nashville area paid more than four times as much as those in the East Central area ($98 vs. $22), on average. Subsidized enrollees in the Greater Chattanooga paid almost three times as much than those in the West Central area ($735 vs. $267). (38) (27)
Figure 15
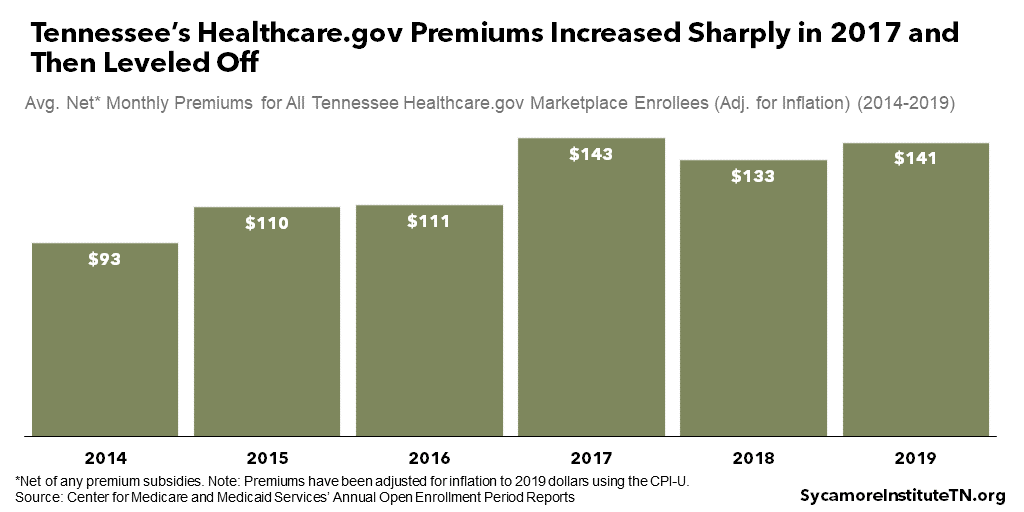
Figure 16
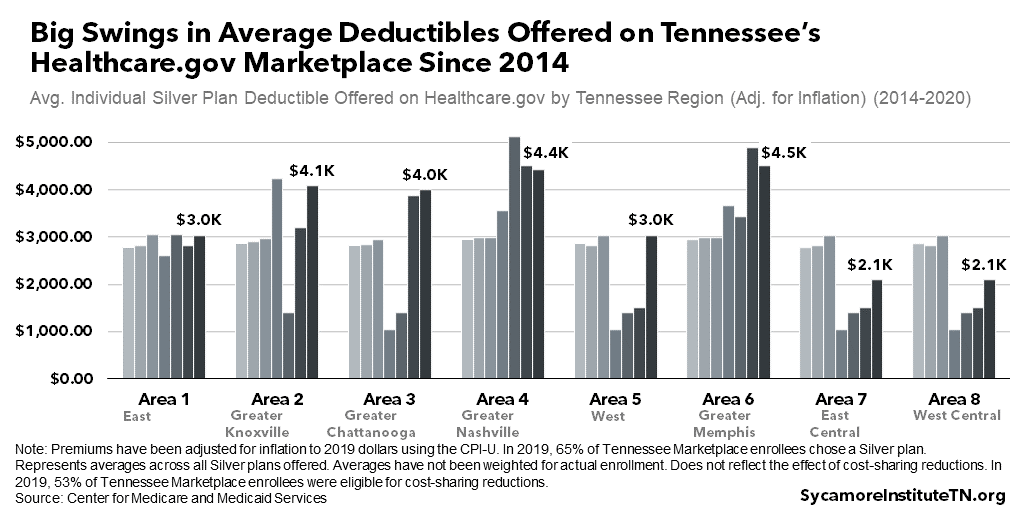
The average deductible across plan options has fluctuated significantly since 2014 (Figure 17). Although data are unavailable on average deductibles based on actual enrollment, deductibles across the Silver plans offered on Healthcare.gov have experienced annual ups and downs in nearly every area. Although some areas experienced larger swings from one year to the next, the Greater Memphis area had the overall biggest change from 2014 to 2020. The average deductible for Silver plans offered in the Greater Memphis area grew from just under $3,000 (adjusted for inflation) for an individual in 2014 to $4,500 during the 2020 open enrollment period — not accounting for cost-sharing reductions that some individuals may receive. (29) (30) (31) (32) (33) (34) (35) (Silver plans are the most commonly selected Marketplace plan.)
Figure 17
Uninsured Tennesseans
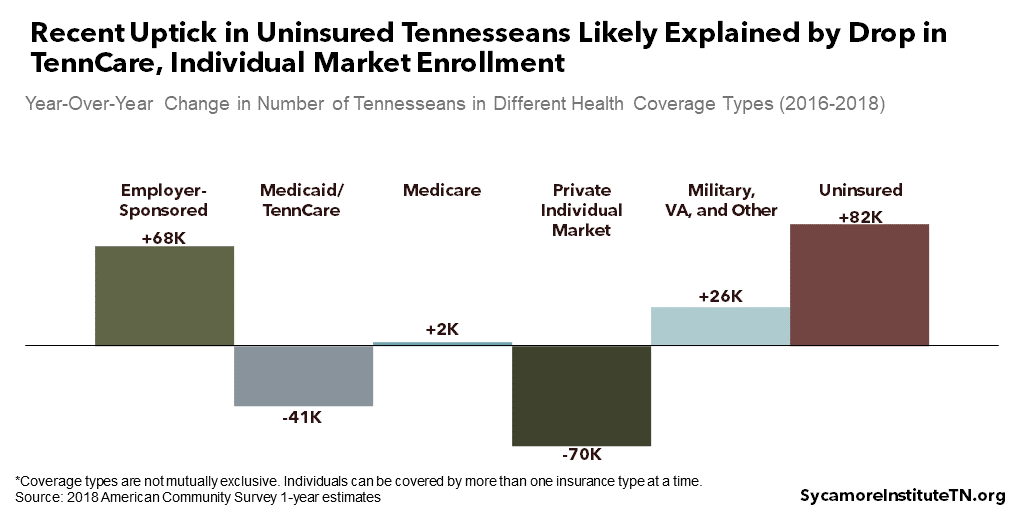
Tennessee’s uninsured rate was an estimated 10.1% in 2018, lower than in 2010 but higher than in 2016 when the rate reached an historic low of 9.0% (Figure 18). Around 675,000 Tennesseans were uninsured in 2018 — about 83,000 more than two years prior. Coverage estimates suggest the uptick among non-elderly Tennesseans is likely explained by the drop in TennCare and private individual market enrollment (Figure 19). (1)
Figure 18
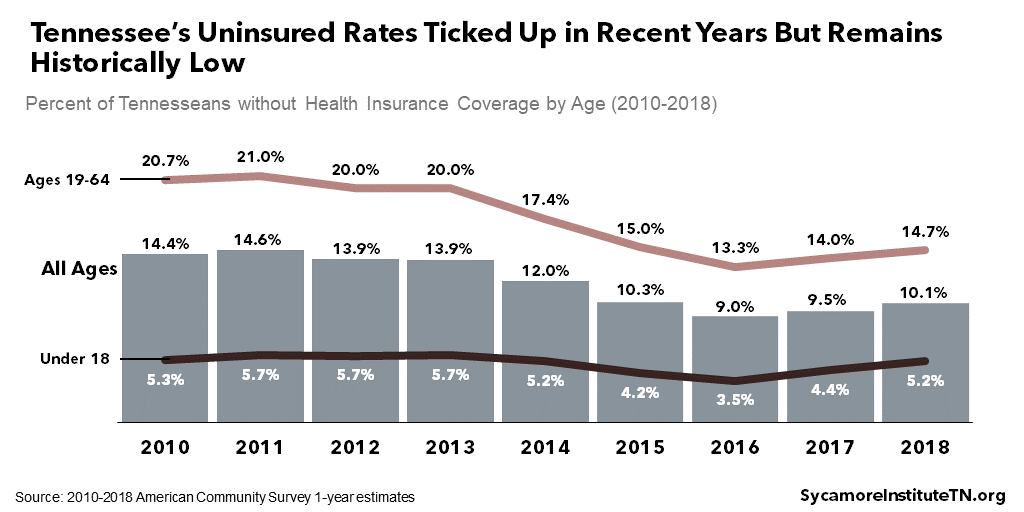
Figure 19
Some Tennesseans are more likely than others to be uninsured — including men, people of color, younger adults, the unemployed, and those with less education and income. These groups each make up a disproportionate share of the uninsured (Figure 20), meaning they all have higher-than-average uninsured rates (Figures 21 and 22). The highest uninsured rates are experienced by: (1)
- Unemployed, working-age adults who are in the labor force — 37% vs. 15% for all working-age adults.
- Hispanic Tennesseans — 30% vs. 8% for non-Hispanic.
- Tennesseans with less than a high school diploma — 22% vs. 10% for all adults ages 25+.
- People ages 26-34 — 18% vs. 10% for all age groups.
Figure 20
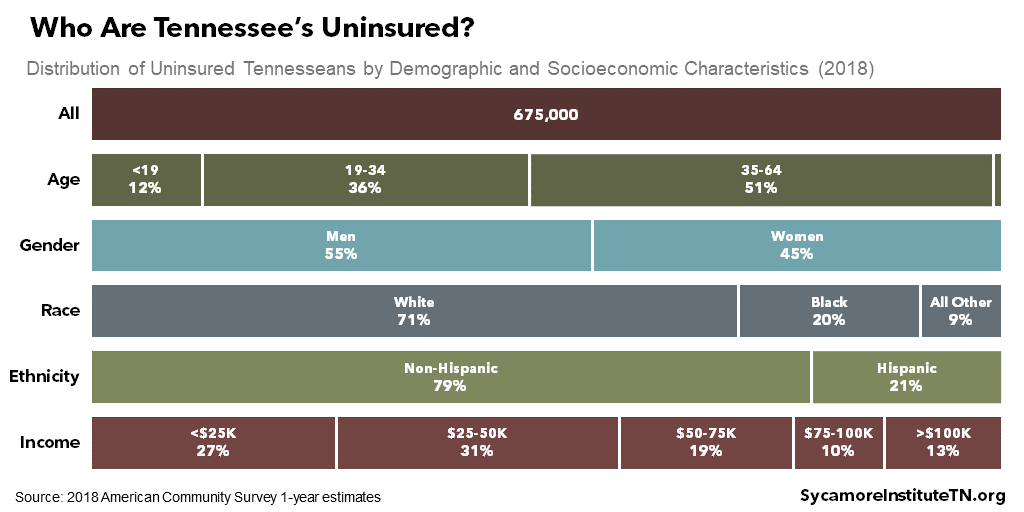
Figure 21
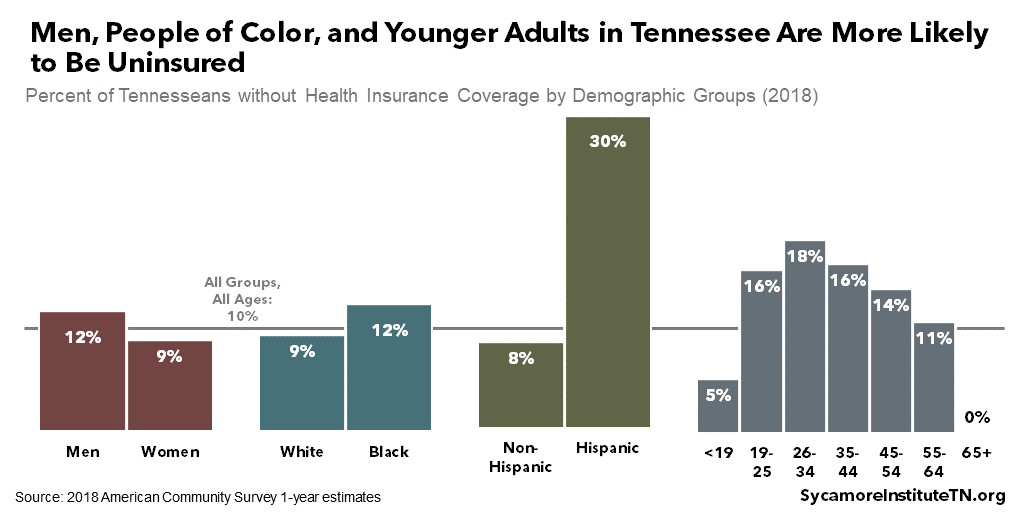
Figure 22
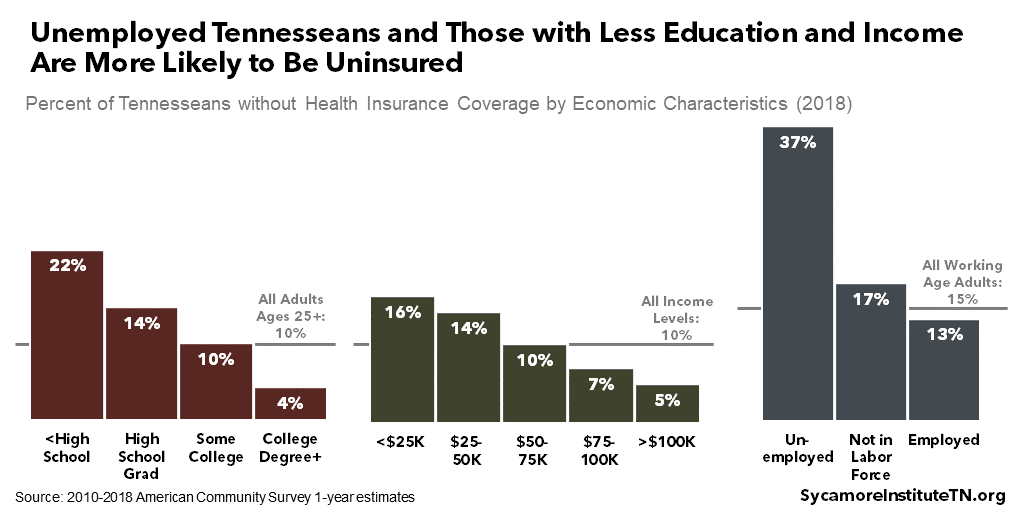
References
Click to Open/Close
- U.S. Census Bureau. 2010-2018 American Community Survey (ACS) 1-Year Estimates. Accessed from http://www.data.census.gov.
- Kaiser Family Foundation. 2019 Employer Health Benefts Annual Survey. September 25, 2019. http://files.kff.org/attachment/Report-Employer-Health-Benefits-Annual-Survey-2019.
- Fernandez, Bernadette, Forsberg, Vanessa and Rosso, Ryan. Federal Requirements on Private Health Insurance Plans. Congressional Research Service. August 28, 2018. https://fas.org/sgp/crs/misc/R45146.pdf.
- Tennessee Department of Commerce and Insurance. 2018 Group Comprehensive Health Market Share. 2019. https://www.tn.gov/content/dam/tn/commerce/documents/insurance/posts/TN_Group_Comprehensive_Health_Market_Share.pdf.
- —. 2018 TN Individual Comprehensive Health Market Share. 2019. https://www.tn.gov/content/dam/tn/commerce/documents/insurance/posts/TN_Individual_Comprehensive_Health_Market_Share.pdf.
- State of Tennessee. Tenn. Code Ann. § 56-2-121(a). 2019. https://advance.lexis.com/api/document/collection/statutes-legislation/id/4WYH-TR40-R03N-D1N6-00008-00?cite=Tenn.%20Code%20Ann.%20%C2%A7%2056-2-121&context=1000516.
- Forsberg, Vanessa and Rosso, Ryan. Applicability of Federal Requirements to Selected Health Coverage Arrangements: An Overview. Congressional Research Service. November 13, 2019. https://crsreports.congress.gov/product/pdf/IF/IF11359.
- Mershon, Erin. This Tennessee Insurer Doesn’t Play by Obamacare’s Rules – And the GOP Sees It as the Future. Stat. November 13, 2017. https://www.statnews.com/2017/11/13/health-insurance-tennessee-farm-bureau/.
- Congressional Budget Office (CBO). Options for Reducing the Deficit: 2019 to 2028 – Reduce Tax Subsidies for Employment-Based Health Insurance. December 13, 2018. https://www.cbo.gov/budget-options/54798.
- —. Federal Subsidies for Health Insurance Coverage for People Under 65: 2019 to 2029. [Online] May 2019. https://www.cbo.gov/system/files/2019-05/55085-HealthCoverageSubsidies_0.pdf.
- U.S. Agency for Healthcare Research and Quality (AHRQ). Medical Expenditure Panel Survey – Insurance Component. 2019. Accessed from https://meps.ahrq.gov/mepsweb/data_stats/quick_tables_search.jsp?component=2&subcomponent=2.
- Hayes, Susan L., Collins, Sarah R. and Radley, David C. How Much U.S. Households with Employer Insurance Spend on Premiums and Out-of-Pocket Costs: A State-by-State Look. The Commonwealth Fund. [Online] May 23, 2019. https://www.commonwealthfund.org/publications/issue-briefs/2019/may/how-much-us-households-employer-insurance-spend-premiums-out-of-pocket.
- U.S. Bureau of Labor Statistics (BLS). Employer Costs for Employee Compensation Historical Listing (March 2004-March 2017). National Compensation Survey. 2017. https://www.bls.gov/ncs/ect/sp/ececqrtn.pdf.
- —. Employer Costs for Employee Compensation – June 2017. National Compensation Survey. September 8, 2017. https://www.bls.gov/news.release/archives/ecec_09082017.pdf.
- —. Employer Costs for Employee Compensation for the Regions – September 2017. National Compensation Survey. December 18, 2017. https://www.bls.gov/regions/southwest/news-release/2017/employercostsforemployeecompensation_regions_20171218.htm.
- —. Employer Costs for Employee Compensation for the Regions – December 2017. National Compensation Survey. March 21, 2018. https://www.bls.gov/regions/southwest/news-release/2018/employercostsforemployeecompensation_regions_20180321.htm.
- —. Employer Costs for Employee Compensation for the Regions – March 2018. National Compensation Survey. June 11, 2018. https://www.bls.gov/regions/southwest/news-release/2018/pdf/employercostsforemployeecompensation_regions_20180611.pdf.
- —. Employer Costs for Employee Compensation for the Regions – June 2018. National Compensation Survey. September 19, 2018. https://www.bls.gov/regions/southwest/news-release/2018/employercostsforemployeecompensation_regions_20180919.htm.
- —. Employer Costs for Employee Compensation for the Regions – September 2018. National Compensation Survey. December 17, 2018. https://www.bls.gov/regions/southwest/news-release/2018/employercostsforemployeecompensation_regions_20181217.htm.
- —. Employer Costs for Employee Compensation for the Regions – December 2018. National Compensation Survey. March 20, 2019. https://www.bls.gov/regions/southwest/news-release/2019/employercostsforemployeecompensation_regions_20190320.htm.
- —. Employer Costs for Employee Compensation for the Regions – March 2019. National Compensation Survey. June 19, 2019. https://www.bls.gov/regions/southwest/news-release/2019/employercostsforemployeecompensation_regions_20190619.htm.
- U.S. Centers for Medicare and Medicaid Services (CMS). Profile of Affordable Care Act Coverage Expansion Enrollment for Medicaid/CHIP and the Health Insurance Marketplace: Tennessee. May 1, 2014. https://aspe.hhs.gov/system/files/pdf/93796/tn.pdf.
- —. Health Insurance Marketplaces 2015 Open Enrollment Period: March Enrollment Report. March 10, 2015. https://aspe.hhs.gov/system/files/pdf/83656/ib_2015mar_enrollment.pdf.
- —. 2016 Open Enrollment Period: Final Open Enrollment Report – State Level Data Excel Tables. March 2016. Accessed from https://aspe.hhs.gov/health-insurance-marketplaces-2016-open-enrollment-period-final-enrollment-report.
- —. 2017 Marketplace Open Enrollment Period State-Level Public Use File. March 11, 2017. Accessed from https://www.cms.gov/Research-Statistics-Data-and-Systems/Statistics-Trends-and-Reports/Marketplace-Products/Plan_Selection_ZIP.html.
- —. 2018 Marketplace Open Enrollment Period State-Level Public Use File. April 3, 2018. Accessed from https://www.cms.gov/Research-Statistics-Data-and-Systems/Statistics-Trends-and-Reports/Marketplace-Products/2018_Open_Enrollment.html.
- —. 2019 Marketplace Open Enrollment Period State-Level Public Use File. 2019. Accessed from https://www.cms.gov/Research-Statistics-Data-and-Systems/Statistics-Trends-and-Reports/Marketplace-Products/2019_Open_Enrollment.
- —. 2020 Federal Health Insurance Exchange Enrollment Period Final Weekly Enrollment Snapshot. January 8, 2020. https://www.cms.gov/newsroom/fact-sheets/2020-federal-health-insurance-exchange-enrollment-period-final-weekly-enrollment-snapshot.
- —. 2014 FFM QHP Data Set. July 31, 2014. Accessed from https://www.healthcare.gov/health-plan-information/.
- —. 2015 QHP Landscape Data. August 3, 2015. Accessed from https://www.healthcare.gov/health-plan-information-2015/.
- —. 2016 QHP Landscape Data. 2016. Accessed from https://www.healthcare.gov/health-plan-information-2016/.
- —. 2017 QHP Landscape Data. August 11, 2017. Accessed from https://www.healthcare.gov/health-plan-information-2017/.
- —. 2018 QHP Landscape Data. July 26, 2018. Accessed from https://www.healthcare.gov/health-plan-information-2018/.
- —. QHP PY19 Medical Individual Landscape Zip File. August 9, 2019. Accessed from https://data.healthcare.gov/dataset/QHP-PY19-Medical-Individual-Landscape-Zip-File/m2uk-wyvh/.
- —. QHP Landscape PY2020 Individual Medical Zip File. December 6, 2019. https://data.healthcare.gov/dataset/QHP-Landscape-PY2020-Individual-Medical-Zip-File/kxp2-7zyr/.
- —. Premium Affordability, Competition, and Choice in the Health Insurance Marketplace, 2014. June 18, 2014. https://aspe.hhs.gov/system/files/pdf/76896/2014MktPlacePremBrf.pdf.
- —. Health Insurance Marketplaces 2016 Open Enrollment Period: Final Enrollment Report. March 11, 2016. https://aspe.hhs.gov/health-insurance-marketplaces-2016-open-enrollment-period-final-enrollment-report.
- —. 2019 Marketplace Open Enrollment Period County-Level Public Use File. 2019. Accessed from https://www.cms.gov/Research-Statistics-Data-and-Systems/Statistics-Trends-and-Reports/Marketplace-Products/2019_Open_Enrollment.

