On February 6, 2023, Tennessee Governor Bill Lee released his $55.6 billion recommendation for the state’s FY 2024 Budget — along with re-estimates and recommended changes for FY 2023. (1) (2) Budgets reflect policymakers’ goals, the public goods and services intended to help meet those goals, and detailed plans to finance them. It is now the job of the legislature to consider and act on this recommendation.
Key Takeaways
- The FY 2024 recommended budget includes unprecedented spending levels fueled by multiple years of significantly better-than-expected state revenue collections.
- Gov. Lee plans to use about $2.8 billion of new recurring revenue for one-time purposes due to continued fears that revenue collections may slow or decline.
- The governor’s FY 2024 overall recommendation is 1.1% (or $619 million) lower than current fiscal year estimates. However, state spending is 11.5% (or $3.1 billion) higher.
- The largest recurring spending increases are recommended for state personnel-related costs, K-12 education, inflationary increases, and a routine change in the federal match for TennCare.
- The largest non-recurring items include capital improvements and General Fund transfers for transportation and state employee retirement liabilities.
- Along with the one-time General Fund transfer, the governor has also proposed the Transportation Modernization Act to address pressures on road funding.
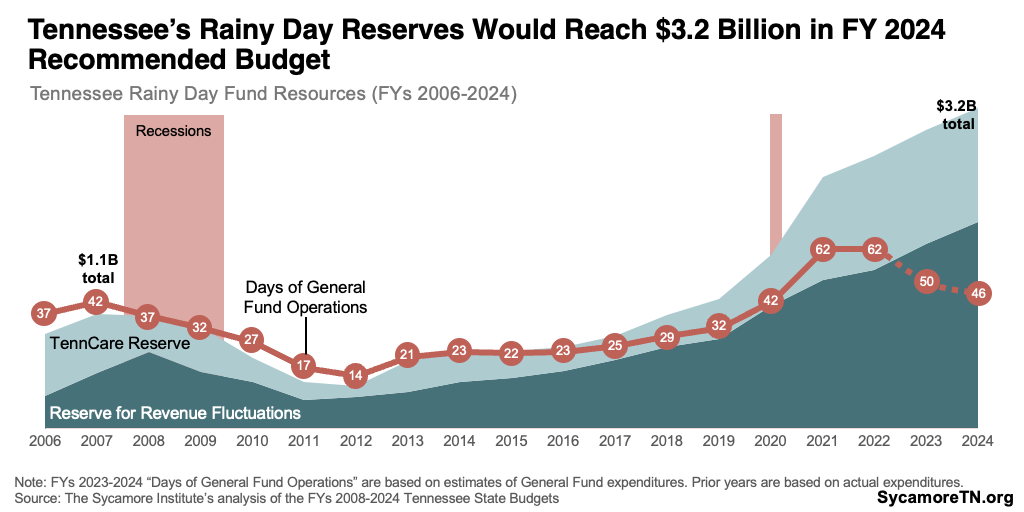
- The two main rainy day reserves combined would total $3.2 billion in FY 2024 and cover about 46 days of General Fund operations — about 4 days more than before the Great Recession.
General Fund Overview
The FY 2024 recommended budget includes unprecedented spending levels fueled by multiple years of significantly better-than-expected state revenue collections. State policymakers have budgeted conservatively since 2020 due to uncertainty about consumer spending and the effects of inflation following the COVID-19 pandemic. To date, revenues have significantly exceeded their cautious estimates — leading to large surpluses and mid-year budget increases (Figure 1).
Compared to current law, Gov. Lee proposes $9.9 billion in additional General Fund spending and allocations in FYs 2023-2024 — mostly from a historic FY 2022 surplus and higher-than-expected FY 2023 revenues. The dollars come from (Figure 2):
- $2.6 billion more in revenue is expected this fiscal year than originally estimated. Six months into the current fiscal year, the state has already collected about $1.1 billion more in General Fund revenues than lawmakers budgeted. (3)
- $3.0 billion more in revenue next fiscal year — including a $2.6 billion base increase from the FY 2023 re-estimate and another $437 million in new FY 2024 tax growth.
- $2.6 billion from the FY 2022 end-of-year surplus.
- $1.3 billion in recurring money that was used for non-recurring purposes in FY 2023.
- $374 million from certain program spending reductions and other revenues and balances.
Figure 1
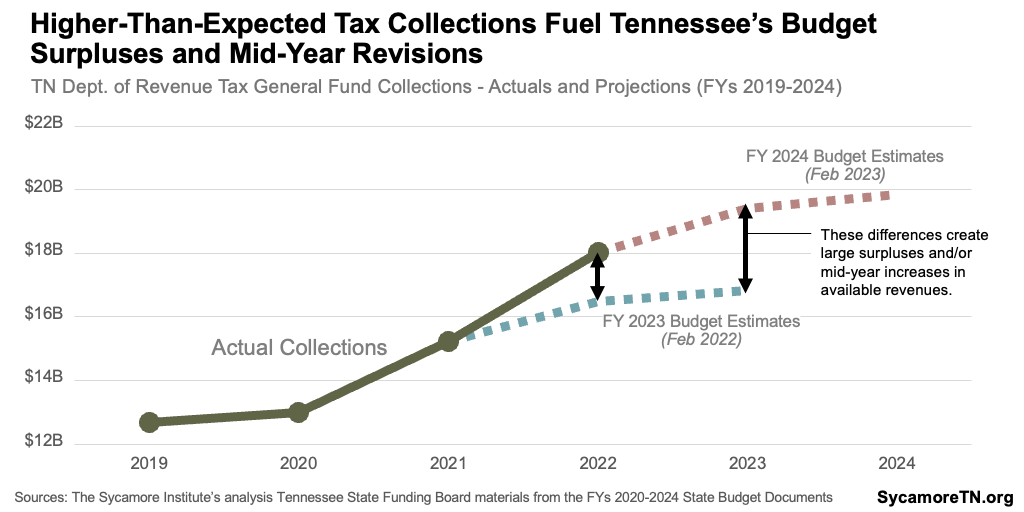
Figure 2
Gov. Lee’s plan uses about $2.8 billion of new recurring revenue for one-time purposes in FY 2024 due to continued fears that revenue collections could slow or even decline. The recommendation puts FY 2024 recurring spending at about 0.8% higher than the revised projection for FY 2023 recurring revenues and 12.9% below the FY 2024 revenue projections. Similarly, the FY 2023 budget used about $1.4 billion of new recurring revenues for one-time purposes (Figure 3). (1) (4)
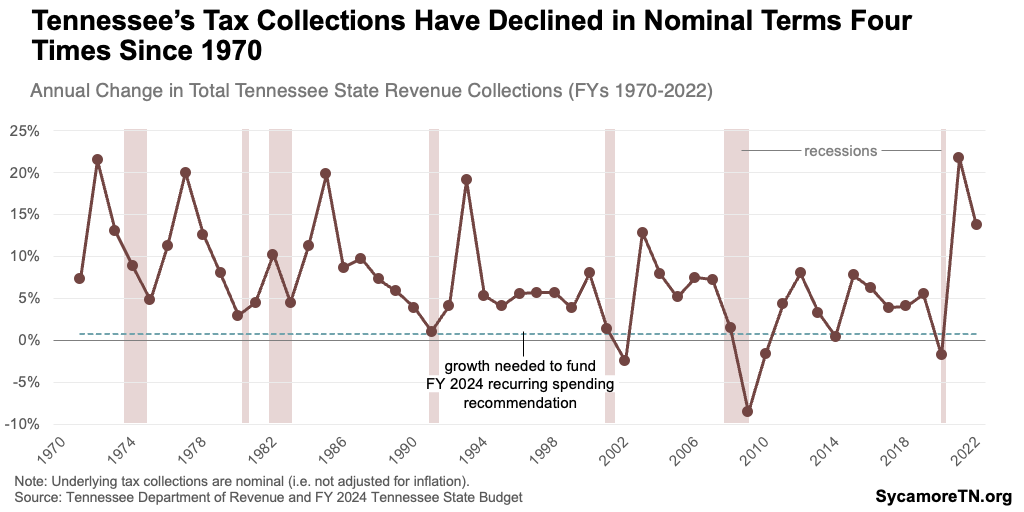
Revenue declines are rare, but some Tennessee policymakers fear that recent consumer spending may not ultimately translate to sustained, long-term growth. Strong consumer spending has driven Tennessee’s better-than-expected sales tax collections in recent years thanks in part to higher-than-usual sales of large, one-time purchases like cars and durable goods (Figure 4). State economists think that won’t last and expect overall taxable sales to grow modestly in the years affecting FYs 2023 and 2024 (Figure 4) (5) If so, Tennessee’s sales tax collections could slow or decline. Without adjusting for inflation, Tennessee’s tax collections have only dropped four times since 1970. However, they have grown less than 0.8% — the rate required to fund this recommendation — five times in that period (Figure 5).
Figure 3
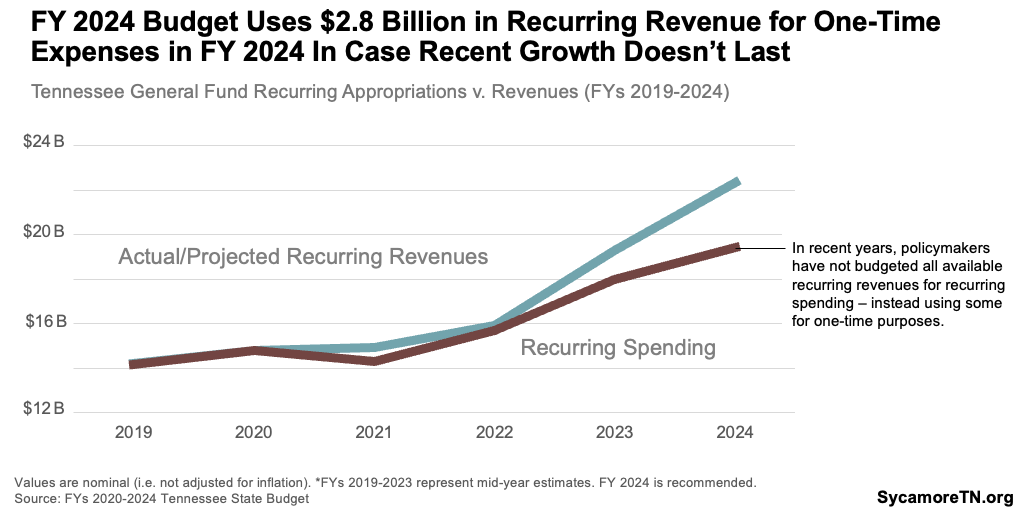
Figure 4
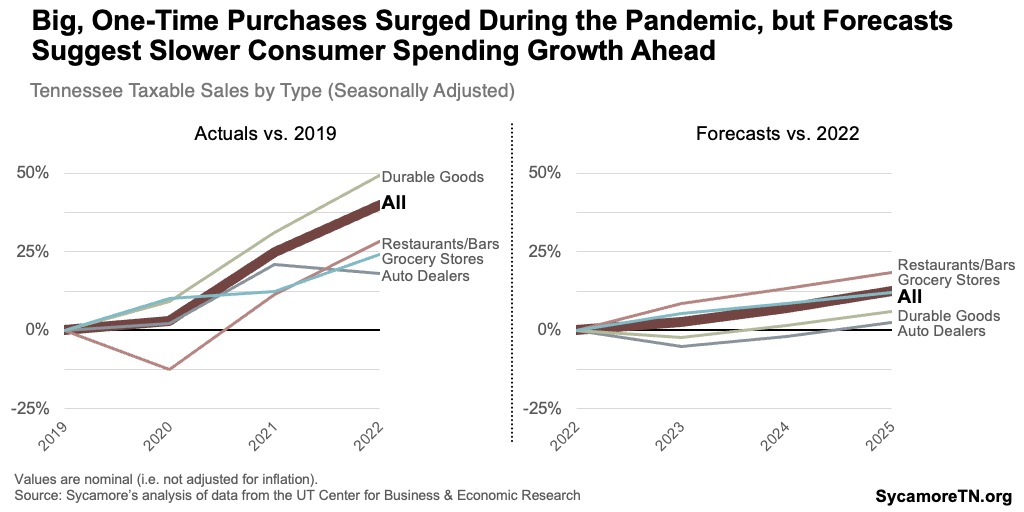
Figure 5
Changes to FY 2023 Budget
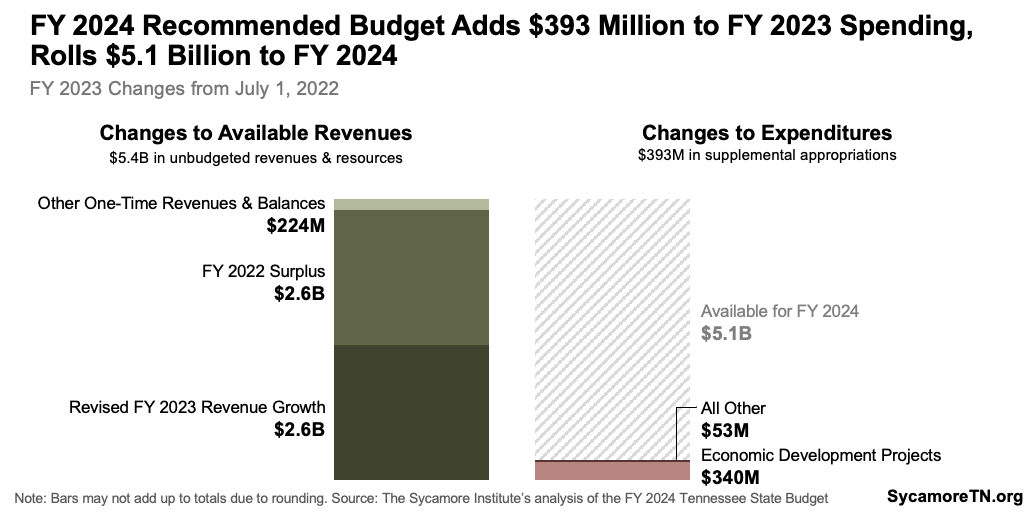
The Budget reflects $393 million of supplemental spending in FY 2023, the current fiscal year (Figure 6). The governor makes supplemental requests each year because actual revenues and spending needs often end up different than originally estimated.
The Budget also anticipates $5.4 billion more available for FY 2023 than was budgeted when the fiscal year began. These funds primarily consist of a $2.6 billion surplus from FY 2022 and $2.6 billion in unbudgeted FY 2023 revenue collections from the mid-year revised estimate discussed earlier. Some of this money funds supplemental spending items, while the remaining $5.1 billion will roll over to FY 2024 as non-recurring revenue to pay for the non-recurring recommendations discussed below.
Figure 6
The FY 2024 Recommended Budget
The FY 2024 recommended budget totals $55.6 billion from all revenue sources, a decrease of 1.1% (or $619 million) below estimates for the current fiscal year. The funding mix is 54% state dollars, 34% federal funding, and 12% from tuition and other sources. Education (26%) and Health and Social Services (41%) account for nearly three-quarters of total expenditures (Figure 7).
Figure 7
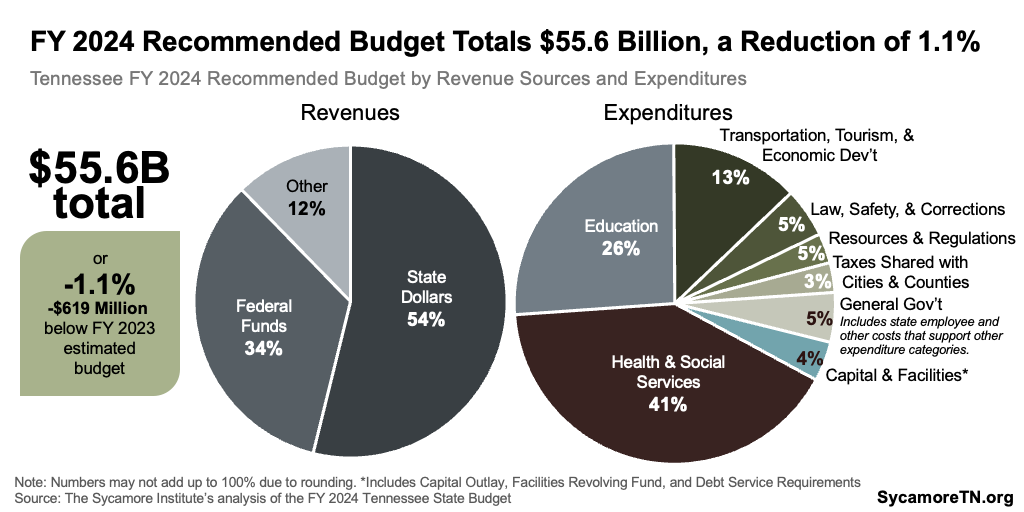
Figure 8
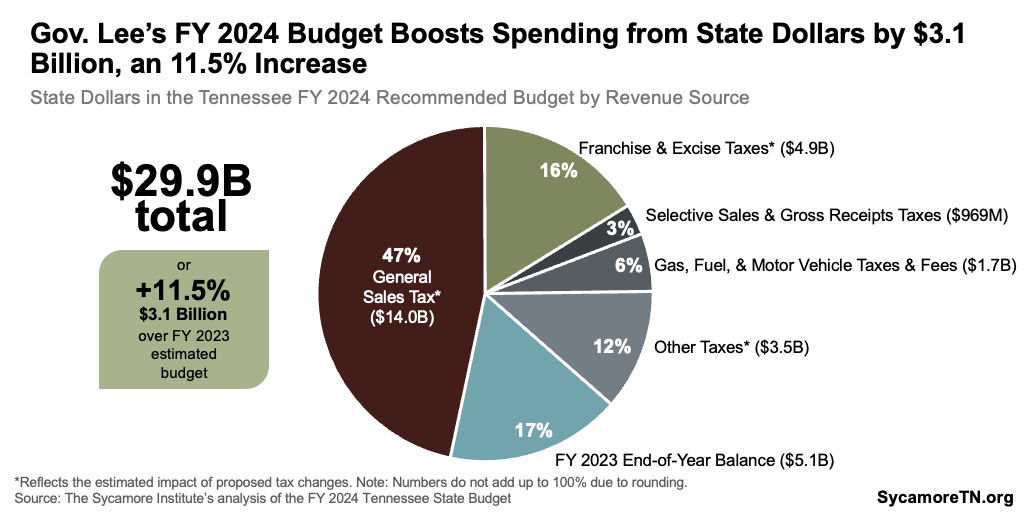
However, state dollars in the recommended budget total $29.9 billion, an increase of 11.5% (or $3.1 billion) from the current year. The $5.1 billion end-of-FY 2023 balance discussed above more than covers this increase. The rest of state dollars in the budget come from taxes — the largest of which are sales tax and business taxes (Figure 8). Education (32%) and Health and Social Services (23%) account for more than half of expenditures from state appropriations. Due to the large increase in available funds, however, spending on transportation and general government items like state employee pay raises take up a larger-than-usual amount of state spending in FY 2024 (Figures 9 and 10).
Figure 9
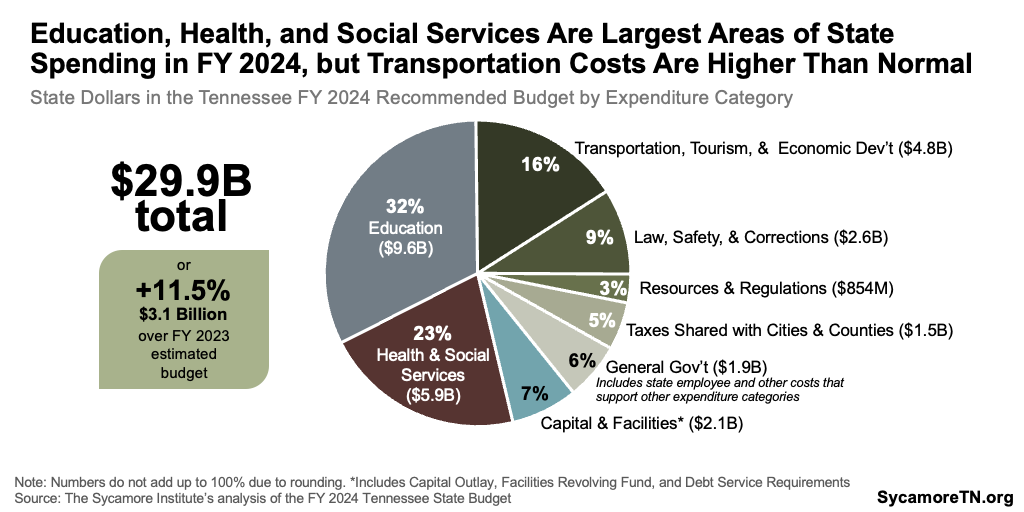
Figure 10
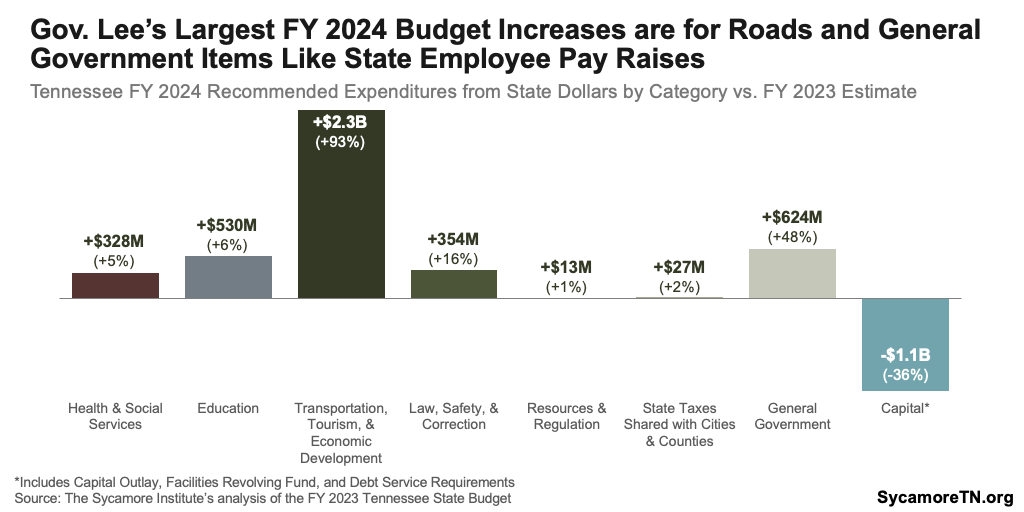
Figure 11
The General Fund in Context
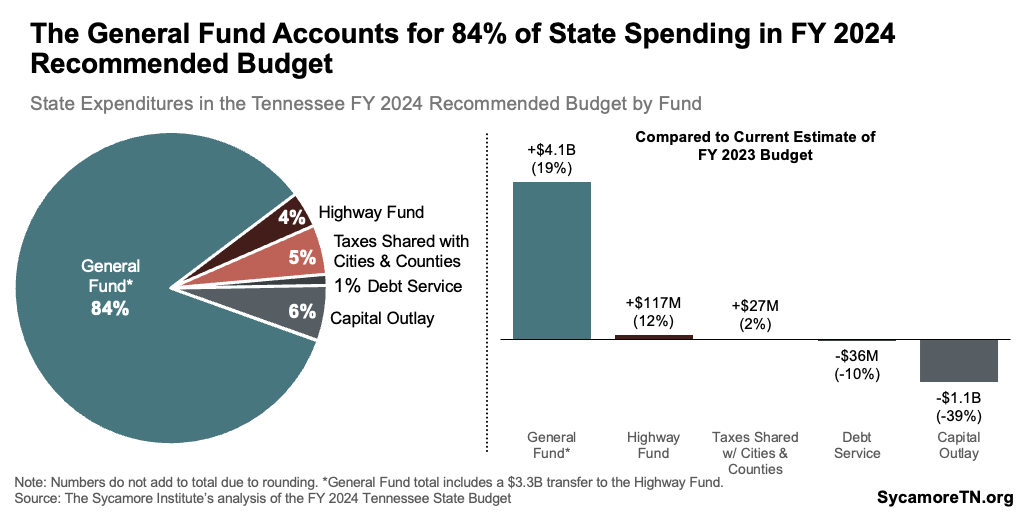
The administration’s recommended budget often focuses on state dollars in the General Fund, which accounts for 84% of all state spending (Figure 11). That number does not include state appropriations for the Capital Outlay Program and Facilities Revolving Fund, which many calculations lump in with the General Fund because they are partly paid for with General Fund revenue.
Recommended Increases and One-Time Spending and Allocations
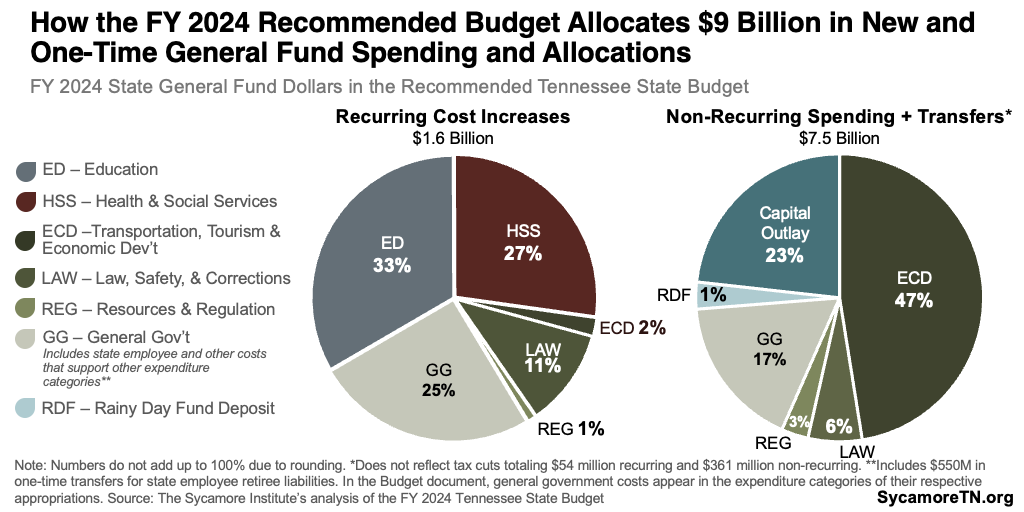
The Budget recommends $1.6 billion in recurring General Fund spending and a total of $7.5 billion in non-recurring spending and transfers (Figure 12). Recurring spending is expected to occur every year and gets added to the budget’s “base,” and non-recurring expenditures are one-time.
The Budget’s Largest Recurring Increases
- +$546 million for personnel-related costs for state employees like salaries, health insurance, and paid leave — including +$125 million for teacher pay increases and +$11 million for salary increases within the Department of Children’s Services (DCS).
- +$337 million for K-12 education (excluding teacher pay increases), which includes +$225 million to fund anticipated student enrollment growth under the state’s new Tennessee Investment in Student Achievement (TISA) school funding formula. Not reflected in this total is a +$750 million recurring increase for implementation of TISA. These dollars were already reserved in the budget for this purpose but spent in other areas in FY 2023.
- +$285 million to fund inflationary cost increases and a routine change in the federal match rate for TennCare, the state’s Medicaid program.
The Budget’s Largest Non-Recurring Allocations
- $3.3 billion General Fund transfer for state and local transportation projects.
- $2.2 billion for capital, technology and equipment investments across state government.
- $800 million in deposits for the state’s rainy day fund and state employee retirement liabilities.
- $234 million for economic and community development grants.
Figure 12
Summary of Governor Lee’s Policy Initiatives
Gov. Lee’s policy initiatives affect the FY 2024 recommended budget in a significant way. The recurring and one-time spending plans discussed in the previous section include the costs summarized below.
Transportation Modernization Act of 2023
Tennessee’s ability to fund road construction and maintenance faces pressures from all sides. Vehicle-related excise taxes set at specific, fixed levels are the largest funding sources for transportation projects in Tennessee. These taxes are not responsive to road funding needs, and the pressures from rising fuel efficiency and electric vehicle (EV) adoption could get worse. Meanwhile, a growing population and inflation has driven the need for more capacity and more dollars.
Gov. Lee’s Budget and his proposed Transportation Modernization Act of 2023 seek to address some of these needs and pressures on state revenues. The administration has not estimated the extent to which the proposal would meet identified needs or on what timeline. However, key features of the proposal include:
- A $3.3 billion one-time General Fund subsidy for state and local transportation needs.
- Higher fees on electric vehicles and new fees on hybrids to backfill expected losses in existing revenue streams — both of which would be shared with local governments.
- Paid choice lanes to address urban congestion using public-private partnerships.
- The authority to use new contracting strategies to reduce construction timelines and costs.
For a more detailed summary and analysis of the governor’s proposal, see our separate brief.
State Employees and Teachers
Gov. Lee proposes a $546 million recurring increase and $36 million non-recurring for personnel-related costs for state employees. These include:
- $210 million recurring for pay increases — including a 5% across-the-board increase, statutorily-required increases, and market rate adjustments.
- $165 million recurring to bring salaries in line with private market salaries for similar positions — on top of the $120 million recurring approved for the same purpose in FY 2023 budget.
- $125 million recurring directed at K-12 teacher pay increases.
- $28 million recurring and $36 million non-recurring for new state employee holidays and benefits.
- $17 million recurring to cover health insurance cost increases.
State Employees
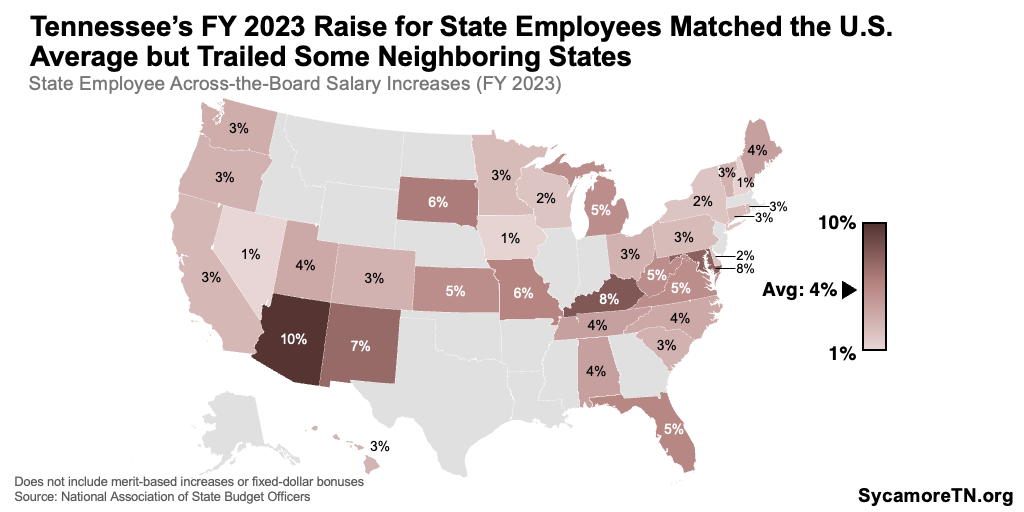
Amid historic inflation, a 5% state employee salary increase would be the highest annual increase since FY 2007 (Figure 13). (7) (1) (8) Last year, policymakers approved a 4% salary increase for FY 2023 — on par with other states that offered across-the-board salary increases. Neighboring states Kentucky, Missouri, and Virginia, however, approved increases between 5-8% for the current fiscal year (Figure 14). (9)
Figure 13
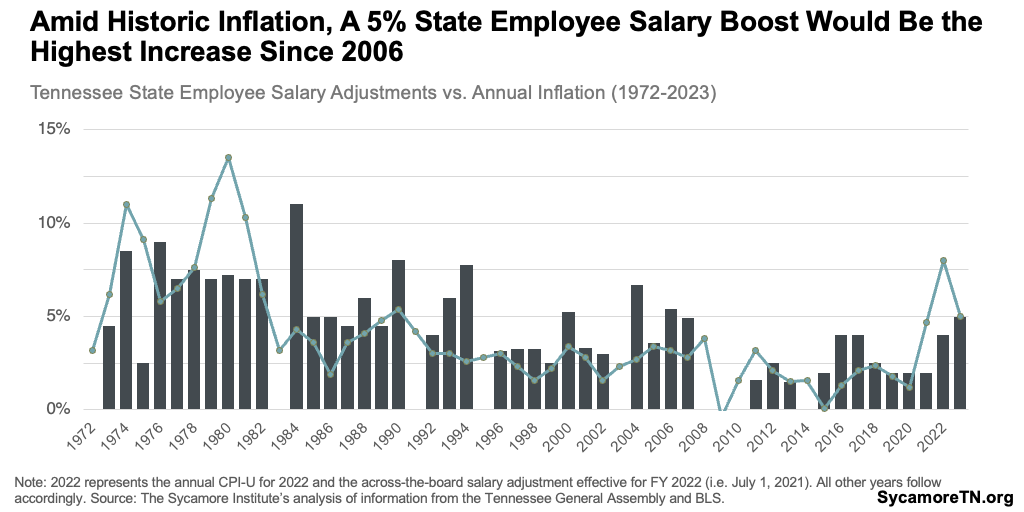
Figure 14
The FY 2024 recommendation also supports several new state employee benefits — including paid family leave. (10) As of March 2022, about 25% of all U.S. workers had access to paid family leave — including about 24% in private industry and 27% in state and local government. (11) Governor Lee signed an executive order to implement a similar policy in 2020 but ultimately dropped it after a cool reception from some legislators grappling with the budget outlook during the pandemic. (12) (13)
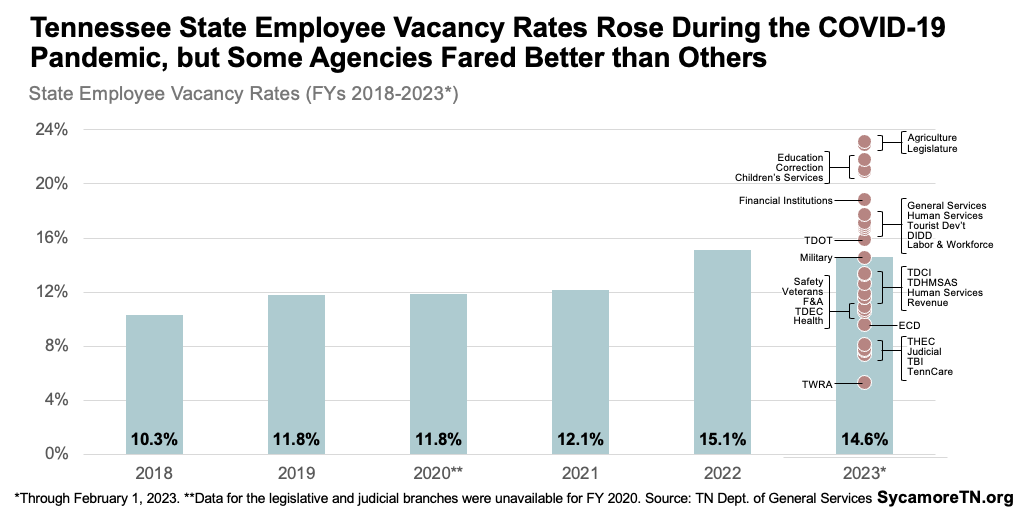
The proposals could help address the worker shortages in Tennessee state government by providing more competitive wages and benefits. Like other states, Tennessee state government employment has not recovered to pre-pandemic levels — lagging the private sector even as funds managed by the state are at a historic high (Figure 15). (14) (15) Meanwhile, state job vacancy rates hit a 5-year high last fiscal year and were higher than usual through the first seven months of FY 2023. Vacancy rates were particularly high in some of the state’s largest and highest profile agencies (Figure 16). (16) Nationally, these trends have been attributed to economy-wide labor issues combined with governments’ inability to nimbly adjust wages and benefits to attract and retain workers through the burnout that accompanies staff shortages. (17) (18) (19) (20)
Figure 15
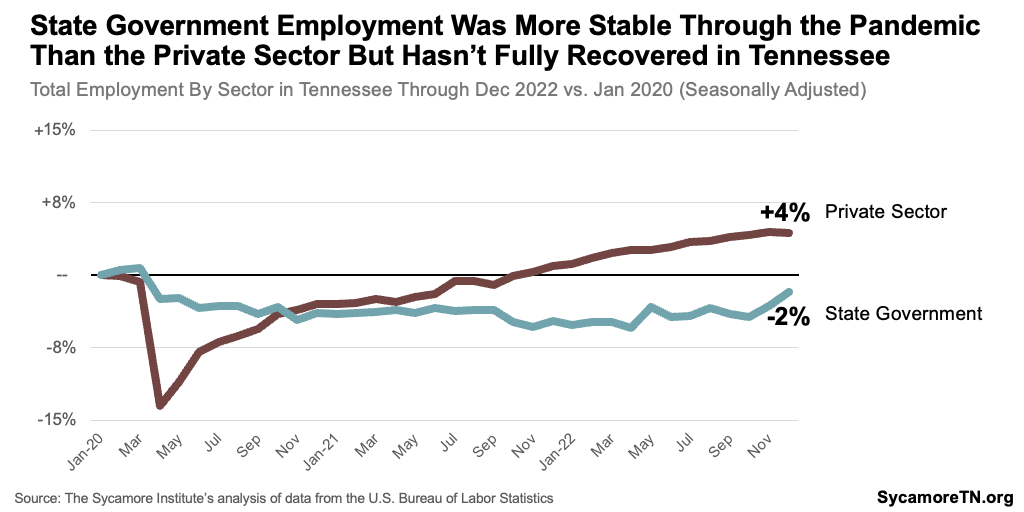
Figure 16
K-12 Teacher Pay Raises
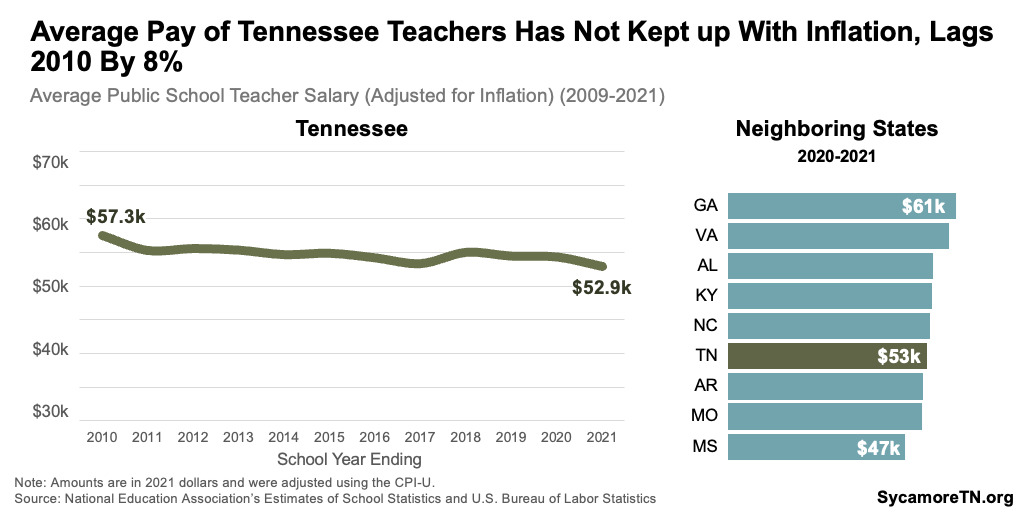
The new funds for personnel costs also include a $125 million recurring increase for teacher salaries. Between FY 2016 and FY 2023, lawmakers enacted a total of $674 million in recurring increases for teacher pay (Figure 17). During that time, growth in Tennessee teachers’ average pay has not kept up with inflation. After adjusting for inflation, teachers’ average pay during the 2020-2021 school year was still about 8% lower than about a decade earlier (Figure 18). (21) (8)
Figure 17
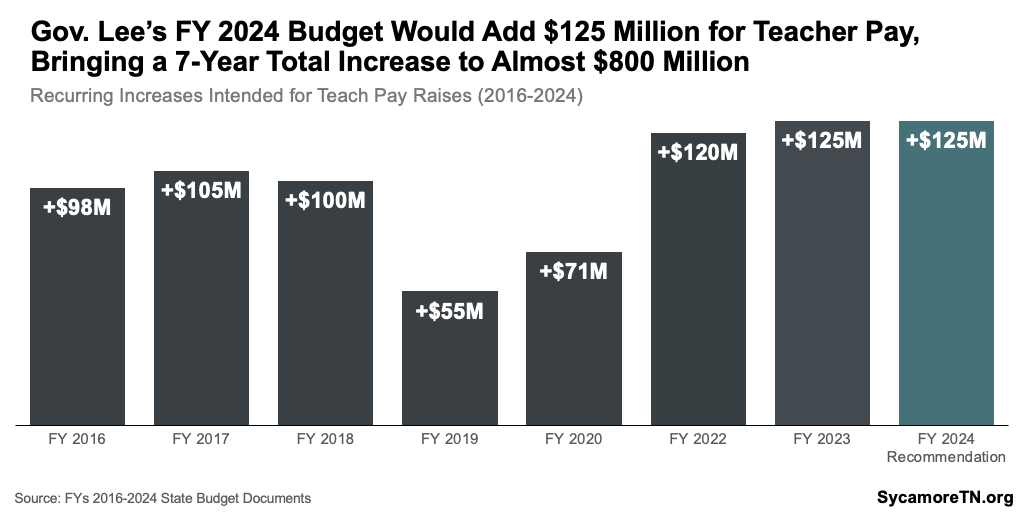
Figure 18
Prior state-funded salary increases haven’t always translated to the teacher raises policymakers hoped to provide, but the state’s new K-12 funding formula may change that. In the past, pay raise dollars were part of a broader component of the Basic Education Program (BEP) formula for instructional pay — contributing to a number of reasons why increased funding didn’t translate to an equivalent boost in pay for teachers. Under the new TISA formula, lawmakers can direct funding increases to be used to raise pay for existing educators. However, these dollars do not readily translate to specific percentage gains since TISA does not cover a defined number of teachers as the BEP did. (22) (23)
Capital, Technology, and Equipment
The governor’s recommendation includes a total of $2.2 billion ($11 million recurring, $2.2 billion non-recurring) for infrastructure, capital projects, maintenance, technology, and equipment.
The Budget allocates $1.7 billion for the state’s Capital Outlay program — the third straight year of significant funding recommendations (Figure 19). All construction and maintenance projects of $100,000 or more are funded through the Capital Outlay program, and the Capital Outlay needs have been growing for years. Gov. Lee recommends $654 million for improvements and major maintenance for state buildings and $1.1 billion for higher education facilities. Highlights include:
- TCAT Improvements and Expansions — $952 million is included in Capital Outlay to fund a statewide master plan for replacing, expanding, and maintaining the 27 existing Tennessee Colleges of Applied Technology (TCATs) and building six new campuses in Athens, Chattanooga, Crossville, Dickson, Elizabethton, and McMinnville. (2) The last two budgets included a total of about $340 million for facility and equipment upgrades, efforts to address waitlists, and a new campus at Blue Oval/the West Tennessee Megasite.
- State Parks — $288 million would fund improvements and maintenance at state parks — including reconstruction of the inns at Natchez Trace State Park in Henderson County ($66 million) and Henry Horton State Park in Marshall County ($63 million).
- TPAC Relocation — $200 million towards relocating the Tennessee Performing Arts Center (TPAC) from its current location in downtown Nashville.
Figure 19
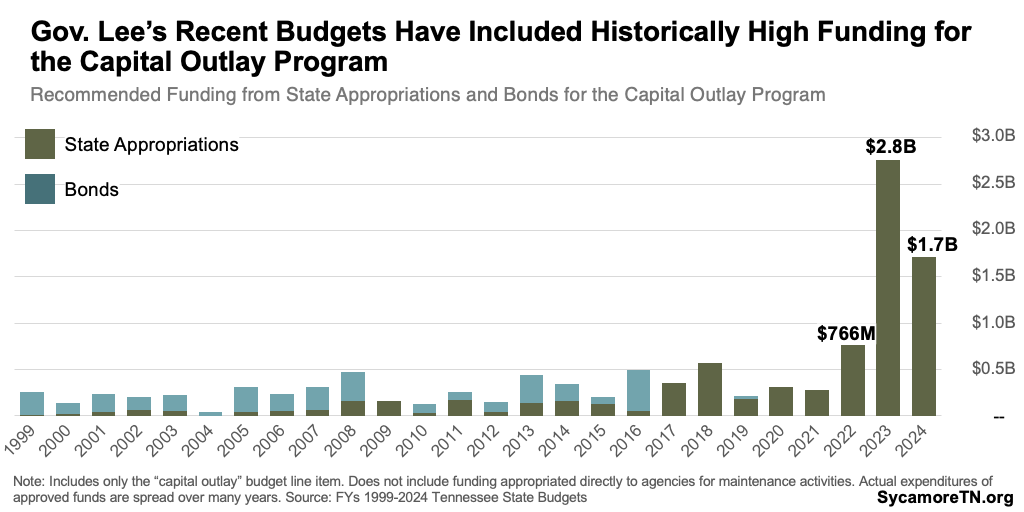
Figure 20

Since FY 2022, the governor has recommended a total of about $6.9 billion — $4.8 billion from the state’s own dollars — for capital spending projects across Tennessee (Figure 20). These dollars will ultimately be spent over many years.
These large one-time investments could create additional cost obligations for the state down the road. Some projects could face cost overruns. For instance, the projected cost of new buildings at Austin Peay and Middle Tennessee State Universities were fully funded in the FY 2022 request — $66 million in state dollars for a health professions building at APSU and $51 million for an applied engineering building at MTSU. (43) The FY 2024 recommendation, however, includes an additional $32 million and $18 million, respectively, for these same projects. Factors like long timelines, inflation, project management capacity, worker shortages, and higher statewide or regional demand could all contribute to these cost increases.
The governor also proposes a separate $350 million subsidy for Memphis’ $684 million plan to replace and renovate three existing professional and college sports stadiums. State funds would offset costs for major renovations to FedEx Forum and the Simmons Bank Liberty Stadium — where the Memphis Grizzlies NBA team and the University of Memphis Tigers football play, respectively. The city also plans to renovate AutoZone Park for the Redbirds minor league baseball team and to replace Mid-South Coliseum with a soccer-specific stadium for the 901 FC professional soccer team. (44)
State and local officials across Tennessee have heavily subsidized stadiums in recent years, which can come with trade-offs. The proposed subsidy for Memphis comes on the heels of about $1.8 billion in taxpayer-funded subsidies state and local officials have committed or planned to commit since 2021 for pro sports venues across Tennessee. Governments often subsidize sports venues for the benefits they expect from attracting or retaining professional teams and large events. According to most economists, however, these stadiums rarely create enough new economic activity to offset public subsidies but may generate other benefits that are hard to quantify.
Tennessee Strong Families
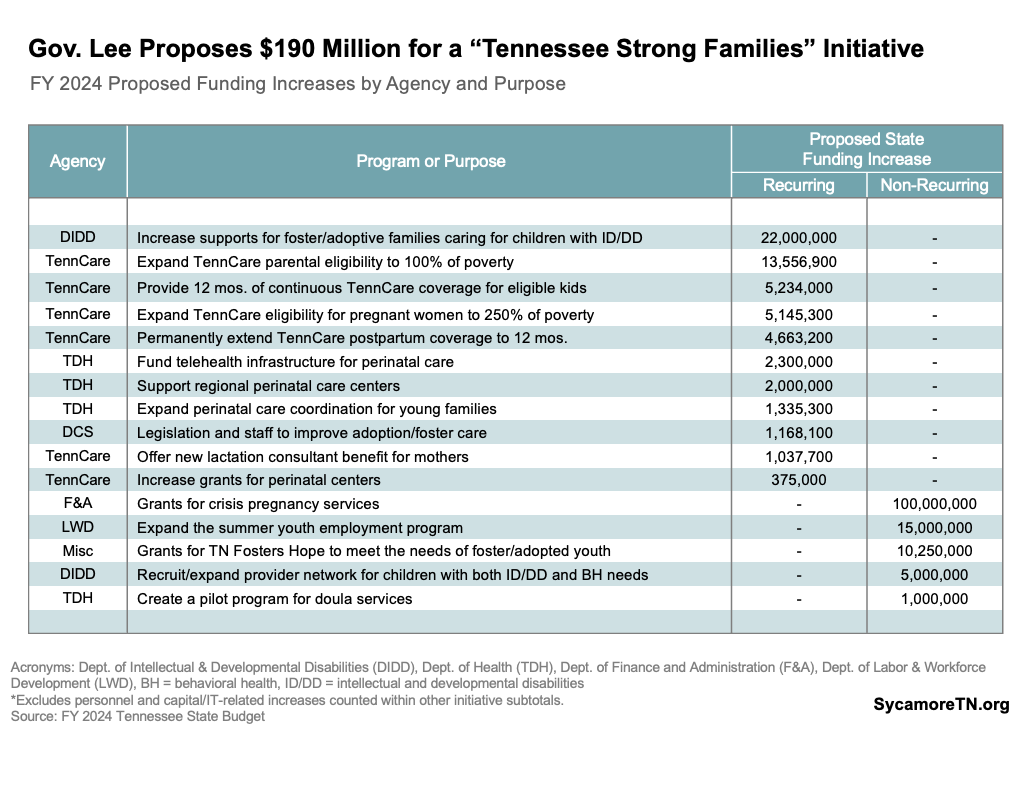
The governor proposes a total of $190 million ($59 million recurring, $132 million non-recurring) for the “Tennessee Strong Families” initiative. The initiative is described as investments in “comprehensive supports for infants, mothers, and vulnerable children” with programs spread across at least six agencies (Table 1). In his state of the state address, the governor connected the initiative with his pro-life stance and the 2022 Supreme Court ruling that overturned Roe v. Wade. (10) State law that took effect after that decision made abortion illegal in Tennessee in nearly all circumstances. Highlights of the proposal are described below.
The initiative proposes $100 million in non-recurring dollars for grants for crisis pregnancy services. Details are not available on the exact use of these proposed funds, and information on crisis pregnancy centers, in general, is highly polarized largely along ideological lines. Unlicensed facilities can only provide non-medical services, such as counseling, parenting classes, free pregnancy tests, and baby items (e.g., diapers). Others are licensed medical clinics and can also offer services like ultrasounds and testing for sexually transmitted diseases. Some centers faced criticism for inaccurate or misleading information about things like the risk of abortion, misrepresenting non-licensed staff as medical professionals, and not being subject to federal privacy laws that govern medical providers. (24) (25) (26) (27) (28)
The governor also proposes $30 million recurring for several new TennCare benefits and eligibility expansions. These proposals would draw down about $56 million in additional federal money. According to TennCare testimony, the state share would be covered through FY 2030 with about $300 million in non-recurring funds from “shared savings” associated with the program’s federal waiver. (29) The coverage expansions include:
- Parent Eligibility — Increasing to 100% of poverty the maximum income limit for parents. Currently, income eligibility is set at specific monthly levels rather than being tied to the federal poverty level. In 2023, for example, this would increase the income limit for a parent in a household of 3 from about $1,600 a month — roughly 88% of federal poverty — to about $1,900. (30) This would be the highest income limit for this eligibility group among the 11 states that have not expanded Medicaid eligibility to all adults under 138% of the poverty level. (31)
- Pregnancy Eligibility — Increasing from 195% of poverty to 250% the maximum income limit for pregnant mothers. (30) This would be the 8th highest income limit for this eligibility group in the country. (32)
- Post-Partum Coverage — Making permanent a previously funded two-year pilot to provide 12 months of TennCare coverage for eligible mothers postpartum. As of 2022, 37 states offer or planned to offer this benefit. (33)
- Continuous Child Medical Coverage — Providing eligible children with 12 months of continuous coverage regardless of changes in income or family size. As of 2022, 24 states offer this benefit. (34)
- Lactation Benefit — Introducing a new lactation consultant benefit for new moms. As of 2021, Tennessee was one of 15 states that did not cover these services. (35)
Table 1
The Department of Children’s Services
The Budget boosts state and federal Department of Children’s Services (DCS) funding by about $220 million in FY 2023 and FY 2024. 1 In FY 2023, this includes $14 million in state funds — all non-recurring — and $13 million in federal. In FY 2024, the request totals $109 million in state money ($76 million recurring, $34 million non-recurring) and $84 million in federal funding. The funds are largely aimed at things like increasing provider rates, caseworker pay, foster care adoption assistance, improving IT systems, and increasing case manager and bed capacity for children moving through the foster care system. (1) (2) (36)
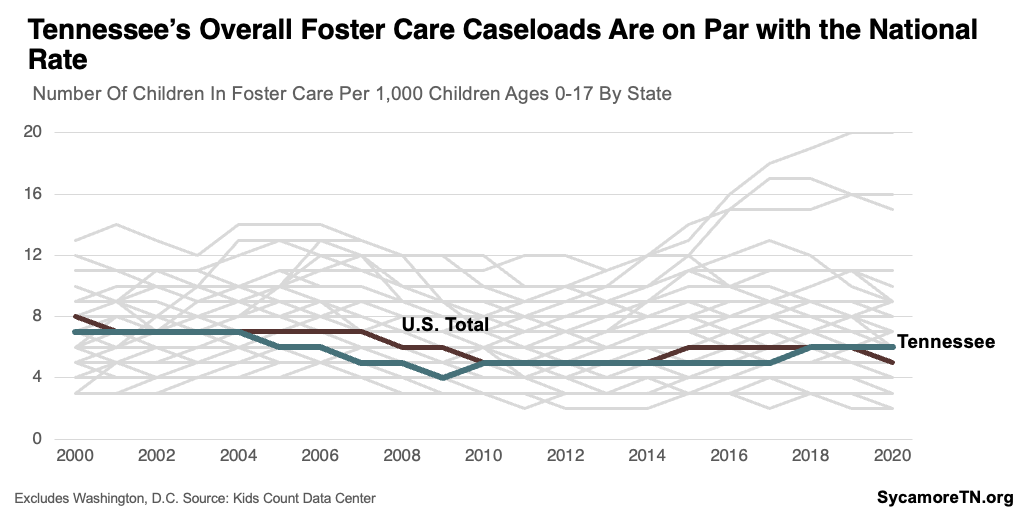
These dollars are meant to address deficiencies within DCS that jeopardize the health, safety, and stability of children in the foster care and adoption systems. The rate of children in Tennessee’s foster care system is not particularly high compared to other states (Figure 21), yet a 2022 comptroller’s audit of DCS found serious issues stemming from (37):
- High case manager workloads and turnover.
- Lack of available foster homes.
- Inadequacies in the electronic case management system.
- Absence of quality standards for transitional placements.
- Failure to investigate reports of abuse and harassment.
- Shortcomings in ensuring children have timely access to medical and dental screenings.
The request includes across-the-board and market rate salary adjustments for DCS workers along with money for contracted case managers to address high workloads, vacancies, and turnover. While many states persistently face similar issues, a 49-state review of caseworker characteristics in 2018 put Tennessee among the worst. It estimated Tennessee’s caseworkers had some of the largest workloads (9th highest) and highest turnover rates (15th highest) in the country between 2003-2015. (38) (39) (40) (41) The comptroller’s audit found that over half of Tennessee’s case manager positions were vacant in parts of the state in 2022, and the annual case manager turnover rate had surged to over 55%. (37)
Figure 21
Tax Cuts
The governor’s recommendation reduces revenues by $414 million with several permanent and temporary tax cuts and a one-time grocery and food tax holiday. Details are as follows:
- Grocery and Food Tax Holiday — The Budget proposes a three-month grocery and food sales tax holiday. This would cost the state a total of $288 million — including the cost to reimburse local governments for lost sales tax.
- Business and Corporate Tax Reductions — Several changes to the state’s business, franchise, and excise taxes would reduce revenues by $123 million — $52 million of which is recurring. The largest of these recurring cuts is aimed at reducing taxes for the smallest businesses by exempting all income and assets below certain thresholds.
Covering Long-Term Retiree Liabilities
Gov. Lee recommends a $550 million one-time deposit to trust funds that help pay for state employee retirement benefits. This includes $300 million for pension liabilities in the Tennessee Consolidated Retirement System (TCRS) and $250 million for other post-employment benefits (OPEB) like health insurance. Another $900 million total has been approved for the same purposes in recent years — including $250 million in FY 2022 and $350 million in FY 2023 for TCRS and $300 million in FY 2023 for OPEB.
State employee retiree costs are long-term financial obligations that — without proper planning — could lead to tax increases, spending cuts, or underfunded benefits down the road. Like all states, Tennessee maintains trust funds for this purpose financed by employee and employer contributions and premiums, earned income from investments, and state appropriations. The state makes long-term projections of what paying these obligations will cost and how much of that cost dedicated revenues will cover.
The proposed General Fund deposit to TCRS will not generate standard matching revenues that typically help fund employer retirement contributions. For routine employer contributions to these funds, the state uses federal dollars or other program-specific revenues that help cover a program’s personnel costs. However, one-time General Fund transfers do not trigger these other funding sources. As a result, funding retirement benefits in this way may ultimately require more General Fund revenue than if the state increased or maintained its employer contribution rates.
Tennessee’s long-term pension liabilities are already fully-funded with existing routine contributions, putting us among the best in the nation for pension liability funding. (45) (46) As of June 30, 2022, the state had funded 103% of its $18.5 billion long-term pension liability – based on a 20-year projection. (47) Recent testimony by state budget officials suggested additional deposits “are not financially necessary” to ensure long-term solvency but will reduce necessary contributions in the future. (48) A number of recent national analyses list Tennessee among the top states for funding its pension liabilities. (49) (50) (51)
Tennessee had funded about 38% of its $1.2 billion in long-term OPEB liabilities as of June 30, 2022. (52) Tennessee only began pre-funding these obligations in FY 2018 and now makes a $72 million recurring deposit for this purpose. Most national analyses rely on data from before or shortly after the state began pre-funding OPEB obligations. The most recent of those placed Tennessee in the middle of the pack compared to other states for funding these obligations. (53) At 38%, however, Tennessee would be near the top of the rankings.
Funds Reserved for Legislative Action
The Budget reserves $10 million in recurring and $20 million in non-recurring funds for initiatives and amendments of the legislature. Another $10 million in recurring and $20 million in non-recurring funds are reserved for the Administration Amendment expected later in the legislative session.
State Tax Revenue Growth
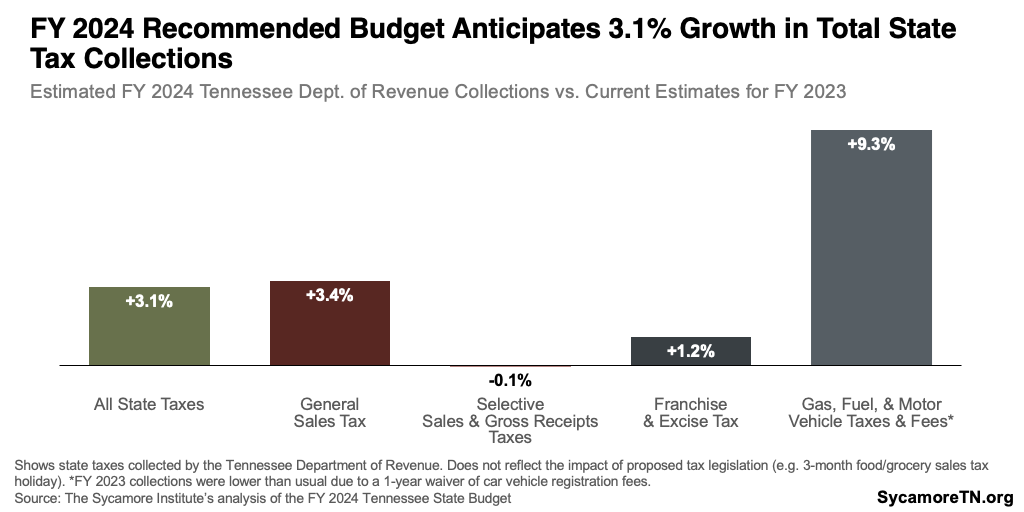
The Budget expects total state tax collections to grow by 3.1% (or $690 million) in FY 2024. The State Funding Board recommended a range of 1.4-2.3% growth in the recurring state tax revenues based on expert estimates that ranged from 3.0-3.8%. Recurring General Fund revenues — which make up about 87% of all Department of Revenue state tax collections — are expected to grow by 2.25% in FY 2024.
The direction and degree of expected change vary by revenue type (Figure 22):
- +3.4% gain ($464 million) in general sales tax collections.
- -0.6% loss (-$600,000) in selective sales and gross receipts taxes collections.
- +1.2% gain ($57 million) in franchise and excise tax collections from businesses.
- +9.3% gain ($142 million) in gas, fuel, and motor vehicle taxes and fees collections — largely due to the rebound from a one-year waiver of vehicle registration fees in FY 2023.
Figure 22
Rainy Day Reserves
The Budget recommends a combined balance of $3.2 billion in the Reserve for Revenue Fluctuations and the TennCare Reserve by the end of FY 2024 (Figure 23). These rainy day reserves are a tool of last resort should Tennessee need to respond to an economic downturn. Reserve balances provide a cushion during a recession, which typically increases demand for state programs and services but decreases the revenues that fund them.
- This combined balance would give the budget about 4 days more cushion than it had just before the Great Recession. At $3.2 billion, the two reserves would cover about 46 days of state-funded General Fund operations at the governor’s recommended FY 2024 levels.
- The Budget hits that mark by adding $250 million to the Reserve for Revenue Fluctuations in FY 2024 This deposit would grow that account to $2.1 billion — the highest dollar amount ever.
- The Reserve for Revenue Fluctuations would exceed its statutory target by about $230 million. State law sets a target for that fund at 8% of General Fund revenues, and the FY 2024 recommended balance represents 9.0%.2
Figure 23
References
Click to Open/Close
-
1. State of Tennessee. Tennessee State Budget for FY 2024. [Online] February 2023. https://www.tn.gov/finance/fa/fa-budget-information/fa-budget-archive/fiscal-year-2023-2024-budget-publications.html
2. Tennessee Department of Finance and Administration. Budget Overview: Fiscal Year 2023-2024. February 6, 2023. https://www.tn.gov/content/dam/tn/finance/budget/documents/overviewspresentations/24_FinalRecommended.pdf
3. —. January Revenues. February 15, 2023. https://www.tn.gov/finance/news/2023/2/15/january-revenues.html
4. State of Tennessee. Tennessee State Budgets for FYs 1995-2023. Available from the Tennessee State Library & Archives and https://www.tn.gov/finance/fa/fa-budget-information/fa-budget-archive.html.
5. University of Tennessee Boyd Center for Business and Economic Research. Tennessee Taxable Sales, Seasonally-Adjusted (millions of current dollars). An Economic Report to the Governor of the State of Tennessee: The State’s January 2023 Economic Outlook. December 2022. https://haslam.utk.edu/publication/economic-report-to-the-governor-2023/
6. Tennessee Department of Revenue. Historical Tax Collections Data. Downloaded from https://www.tn.gov/revenue/tax-resources/tax-collections-information/additional-resources-for-researchers.html.
7. Office of Legislative Budget Analysis. Salary Policy History (FYs 1974-2022). Tennessee General Assembly. Accessed on February 03, 2023 https://www.capitol.tn.gov/Archives/Joint/staff/budget-analysis/docs/Salary%20History%20(thru%2021-22).pdf.
8. U.S. Bureau of Labor Statistics. Consumer Price Index for All Urban Consumers: All Items in U.S. City Average [CPIAUCSL]. Retrieved from FRED, Federal Reserve Bank of St. Louis; https://fred.stlouisfed.org/series/CPIAUCSL
9. The National Association of State Budget Officers. The Fiscal Survey of States: Fall 2022. Fall 2022. https://higherlogicdownload.s3.amazonaws.com/NASBO/9d2d2db1-c943-4f1b-b750-0fca152d64c2/UploadedImages/Fiscal%20Survey/NASBO_Fall_2022_Fiscal_Survey_of_States_S.pdf
10. Gov. Bill Lee. 2023 State of the State Address. February 6, 2023. https://www.tn.gov/governor/sots/2023-state-of-the-state-address.html
11. U.S. Bureau of Labor Statistics. Employee Benefits in the United States: Latest Numbers (March 2022). September 22, 2022. Accessed on February 16, 2023 https://www.bls.gov/ebs/latest-numbers.htm.
12. Office of the Governor. Tennessee Offers State Employees Paid Family Leave. State of Tennessee. January 7, 2020. https://www.tn.gov/governor/news/2020/1/7/tennessee-offers-state-employees-paid-family-leave.html
13. Associated Press. Tennessee Governor Won’t Revive Paid Family Leave Push. February 11, 2021. https://newschannel9.com/news/local/tennessee-governor-wont-revive-paid-family-leave-push
14. U.S. Bureau of Labor Statistics. Total Private Employees, Tennessee – Statewide, Seasonally-Adjusted (Series ID SMS47000000500000001). State and Area Employment, Hours, and Earnings. Accessed on February 16, 2023 from https://data.bls.gov/pdq/SurveyOutputServlet.
15. —. Total State Government Employees, Tennessee – Statewide, Seasonally-Adjusted (Series ID SMS47000009092000001). State and Area Employment, Hours, and Earnings. Accessed on February 16, 2023 from https://data.bls.gov/pdq/SurveyOutputServlet.
16. Tennessee Department of General Services. Information provided by request on February 13, 2023.
17. Peck, Emily. The Government is Having a Hard Time Hiring. Axios. July 11, 2022. https://www.axios.com/2022/07/11/government-jobs-pandemic-recovery-federal-state
18. Brey, Jared. Government Worker Shortages Worsen Crisis Response. Governing. October 3, 2022. https://www.governing.com/work/government-worker-shortages-worsen-crisis-response
19. Federal Times. Staff Shortages Fueling Government Worker Burnout, Survey Says. September 19, 2022. https://www.federaltimes.com/management/2022/09/19/staff-shortages-fueling-government-worker-burnout-survey-says/
20. Cunningham, Josh. Inclusive Employment Practices in State Government. National Conference of State Legislatures. March 21, 2022. https://www.ncsl.org/labor-and-employment/inclusive-employment-practices-in-state-government
21. National Education Association. Rankings and Estimates Reports for 2011-2022. Available from https://www.nea.org/research-publications.
22. State of Tennessee. Tenn. Code Ann. § 49-3-105(e) – effective July 1, 2023. Accessed on February 16, 2023 from Lexis.
23. Tennessee General Assembly. HB 1545 / SB 1532. February 2023. https://www.capitol.tn.gov/Bills/113/Bill/HB1545.pdf
24. Tennessee Higher Education Commission. Capital Projects Recommendation: THEC 2021-22 Capital Projects Recommendation Summary. Accessed on February 16, 2023 at https://www.tn.gov/content/dam/tn/thec/bureau/fiscal_admin/capital_outlay/capital-budget/captbudget/2021/THEC%20FY2021-22%20Capital%20Recommendation.pdf.
25. Samuel, Hardiman. Memphis’ Big Plan: $684M in Stadium Plans for Grizzlies, Tigers Football and Replacing the Mid-South Coliseum. Memphis Commercial Appeal. October 18, 2022. https://www.commercialappeal.com/story/news/2022/10/18/memphis-asks-state-684-million-fedexforum-liberty-stadium-renovations/69564167007/.
26. Tolan, Casey, de Puy Kamp, Majlie and Chapman, Isabelle. The Crisis Pregnancy Center Next Door: How Taxpayer Money Intended For Poor Families is Funding a Growing Anti-Abortion Movement. CNN. October 25, 2022. https://www.cnn.com/2022/10/25/us/crisis-pregnancy-centers-taxpayer-money-invs/index.html.
27. McFadden, Cynthia, Amorebieta, Maite and Martinez, Didi. In Texas, State-Funded Crisis Pregnancy Centers Gave Medical Misinformation to NBC News Producers Seeking Counseling. NBC News. June 29, 2022. https://www.nbcnews.com/politics/supreme-court/texas-state-funded-crisis-pregnancy-ce nters-gave-medical-misinformatio-rcna34883.
28. North, Anna. What “Crisis Pregnancy Centers” Really Do. Vox. March 2, 2020. https://www.vox.com/2020/3/2/21146011/crisis-pregnancy-center-resource-abortion-title-x.
29. Charlotte Lozier Institute. Fact Sheet: Pregnancy Centers – Serving Women and Saving Lives (2020 Study). July 2021. https://lozierinstitute.org/fact-sheet-pregnancy-centers-serving-women-and-saving-lives-2020/.
30. Abkin, Kelsey and Pinto-Garcia, Patricia. What Are Crisis Pregnancy Centers, and What Do They Do? Good Rx Health. February 28, 2022. https://www.goodrx.com/health-topic/parenthood-pregnancy/crisis-pregnancy-centers
31. House Finance, Ways, and Means Committee. TennCare Testimony. February 21, 2023. Video available from https://tnga.granicus.com/player/event/6892?&redirect=true.
32. TennCare. TennCare Eligibility Reference Guide. January 2023. https://www.tn.gov/content/dam/tn/tenncare/documents/eligibilityrefguide.pdf
33. Kaiser Family Foundation (KFF). Medicaid Income Eligibility Limits for Adults as a Percent of the Federal Poverty Level as of January 1, 2022. https://www.kff.org/health-reform/state-indicator/medicaid-income-eligibility-limits-for-adults-as-a-percent-of-the-federal-poverty-level/?currentTimeframe=0&sortModel=%7B%22colId%22:%22Parents%20(in%20a%20family%20of%20three)%22,%22sort%22:%22desc%22%7D
34. —. Medicaid and CHIP Income Eligibility Limits for Pregnant Women as a Percent of the Federal Poverty Level as of January 1, 2022. https://www.kff.org/health-reform/state-indicator/medicaid-and-chip-income-eligibility-limits-for-pregnant-women-as-a-percent-of-the-federal-poverty-level/?currentTimeframe=0&sortModel=%7B%22colId%22:%22Medicaid%22,%22sort%22:%22desc%22%7D
35. —. Status of State Adoption of 12-Months Postpartum Coverage in Medicaid as of October 27, 2022. https://www.kff.org/other/state-indicator/status-of-state-adoption-of-12-months-postpartum-coverage-in-medicaid/?currentTimeframe=0&sortModel=%7B%22colId%22:%22Location%22,%22sort%22:%22asc%22%7D
36. —. State Adoption of 12-Month Continuous Eligibility for Children’s Medicaid and CHIP as of January 1, 2022. https://www.kff.org/health-reform/state-indicator/state-adoption-of-12-month-continuous-eligibility-for-childrens-medicaid-and-chip/?currentTimeframe=0&sortModel=%7B%22colId%22:%22Medicaid%22,%22sort%22:%22asc%22%7D
37. Ranji, Usha, et al. Medicaid Coverage of Pregnancy-Related Services: Findings from a 2021 State Survey . Kaiser Family Foundation (KFF). May 19, 2022. https://www.kff.org/report-section/medicaid-coverage-of-pregnancy-related-services-findings-from-a-2021-state-survey-report/#:~:text=Breastfeeding%20Supports,-A%20range%20of&text=States%20are%20required%20to%20cover,for%20coverage%20of%20breastfeeding%20s
38. House Finance, Ways, and Means Committee. DCS Testimony. Tennessee General Assembly. January 30, 2023. Video available from https://tnga.granicus.com/player/clip/27328?view_id=726&redirect=true&h=207877ea7616320e5d1768fa1d84c624.
39. Tennessee Comptroller of the Treasury. Performance Audit Report: Department of Children’s Services 2022. December 2022. https://comptroller.tn.gov/content/dam/cot/sa/advanced-search/2022/pa22033.pdf
40. Paul, Megan, et al. Worker Turnover is a Persistent Child Welfare Challenge – So is Measuring It . Quality Improvement Center for Workforce Development. January 24, 2022. https://www.qic-wd.org/qic-take/worker-turnover-persistent-child-welfare-challenge
41. The Sycamore Institute. Review of “State and Local Examples: Turnover and Improving Retention”. Administration for Children & Families, U.S. Department of Health & Human Services. https://www.childwelfare.gov/topics/management/workforce/workforcewellbeing/retention/examples/
42. Child Welfare Information Gateway. Issue Brief: Caseload and Workload Management. Administration for Children & Families, U.S. Department of Health & Human Services. September 2022. https://www.childwelfare.gov/pubpdfs/case_work_management.pdf
43. Edwards, Frank and Wildeman, Christopher. Characteristics of the Front-Line Child Welfare Workforce. Children and Youth Services Review. June 2018. https://doi.org/10.1016/j.childyouth.2018.04.013 (draft available via https://www.qic-wd.org/characteristics-front-line-child-welfare-workforce)
44. The Annie E. Casey Foundation Kids Count Data Center. Children Ages Birth to 17 in Foster Care in the United States (2000-2021). Child Trends analysis of data from the Adoption and Foster Care Analysis and Reporting System (AFCARS), made available through the National Data Archive on Child Abuse and Neglect. April 2022. Available from https://datacenter.kidscount.org/data/tables/6242-children-ages-birth-to-17-in-foster-care?loc=1&loct=2#detailed/2/2-53/false/574,1729,37,871,870,573,869,36,868,867/any/20455
45. Pew. The State Pension Funding Gap: Plans Have Stabilized in Wake of Pandemic. September 14, 2021. https://www.pewtrusts.org/en/research-and-analysis/issue-briefs/2021/09/the-state-pension-funding-gap-plans-have-stabilized-in-wake-of-pandemic
46. The Volcker Alliance. State Budget Practice Report Cards: Tennessee. February 5, 2023. https://www.volckeralliance.org/state-budgets/tennessee
47. State of Tennessee. Tennessee Consolidated Retirement Fund: Schedule of Changes in the State of Tennessee’s Net Pension Liability (Asset) and Related Ratios. FY 2022 Annual Comprehensive Financial Report. December 2022. https://www.tn.gov/content/dam/tn/finance/acfr/ACFR_fy22.pdf
48. House Finance, Ways, and Means Committee. Testimony by officials from the Tennessee Department of Finance and Administration (at approx. 44:00). Tennessee General Assembly. February 7, 2023. Video available at https://tnga.granicus.com/player/clip/27433?view_id=726&redirect=true&h=2ea8e55c5f15dabfa75cd4f68bbb69ab.
49. Biernacka-Lievestro, Joanna and Fleming, Joe. States’ Unfunded Pension Liabilities Persist as Major Long-Term Challenge . Pew. July 7, 2022. https://www.pewtrusts.org/en/research-and-analysis/articles/2022/07/07/states-unfunded-pension-liabilities-persist-as-major-long-term-challenge
50. American Legislative Exchange Council. Unaccountable and Unaffordable (6th Edition). June 2022. https://alec.org/wp-content/uploads/2022/06/UAUA-6th-Edition-WEB-1.pdf
51. The Volcker Alliance. State Employee Pension Funding. March 31, 2021. https://www.volckeralliance.org/resources/state-employee-pension-funding-data-set-and-interactive-visualization
52. State of Tennessee. Other Postemployment Benefits: Schedule of Changes in the Net OPEB Liability and Related Ratios. FY 2022 Annual Comprehensive Financial Report. December 2022. https://www.tn.gov/content/dam/tn/finance/acfr/ACFR_fy22.pdf
53. American Legislative Exchange Council. Other Post-Employment Benefit Liabilities – 5th Edition. July 2022. https://alec.org/wp-content/uploads/2021/06/2020-OPEB-FINAL.pdf

