Key Takeaways
- Tennessee’s population grew over the past decade to 7.3 million—largely driven by new residents from other states.
- Although Tennessee is geographically rural, most people live in just a few urban areas.
- Tennessee’s population is aging—with the number of Tennesseans ages 65 and older increasing by 30% over the last decade.
- Tennessee’s population became more racially and ethnically diverse over the last decade, but these trends varied significantly by county.
- Population growth and demographic shifts come with policy implications.
The decisions made by Tennessee’s next governor and General Assembly will shape the state’s future for years to come. Throughout the remainder of 2026, The Sycamore Institute will release a series of concise, evidence-based insights drawn from our past research to provide context on the policies, trends, and challenges that could define Tennessee’s next chapter. Each brief offers a quick, accessible overview of an important issue and links to deeper analysis for those who want to explore it further.
This brief focuses on who lives in Tennessee—including population size, composition, and demographic trends over the last decade.
1. Tennessee’s population grew over the past decade to 7.3 million—largely driven by new residents from other states.
Between 2016 and 2025, Tennessee’s population grew 10%—from 6.6 million to 7.2 million people. During this time, Tennessee’s population grew by about 669,000 people—or 1.0% per year on average (Figure 1). This made Tennessee the 9th fastest-growing state in the country over this period (Figure 2). (1) (2)
Population trends, however, varied significantly across the state during this time—from a 32% increase in Wilson County to a 17% decline in Lake. Between 2016 and 2025, 85 counties experienced population increases while just 10 saw declines (Figure 3). (3) (4)
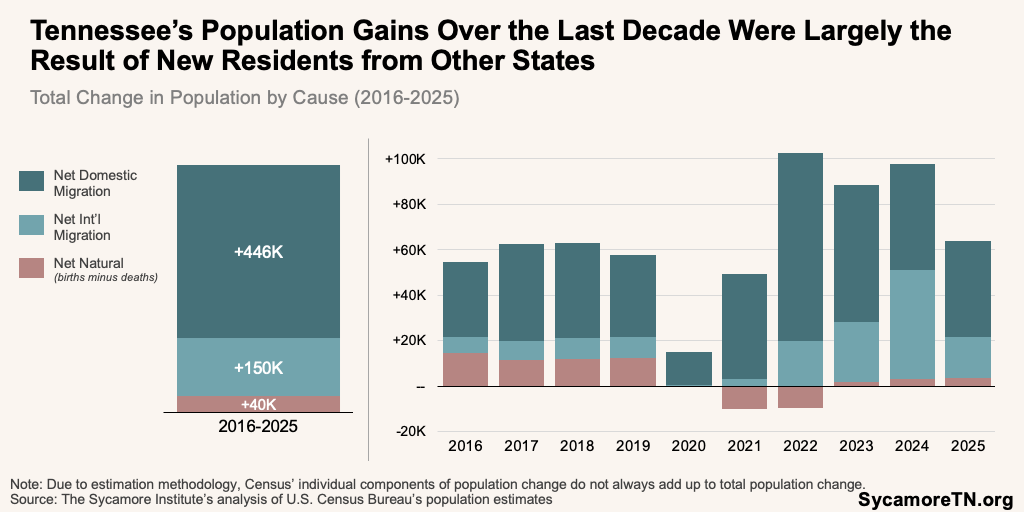
Tennessee’s statewide population gains over the last decade were largely the result of new residents from other states (Figure 4). Over the course of 2016-2025, 74% of Tennessee’s population growth was attributable to net domestic migration—or the difference between people moving into and out of Tennessee from other states. Another 20% was from to net international migration, and the rest from net natural growth (i.e., births minus deaths). (1) (2)
Figure 1
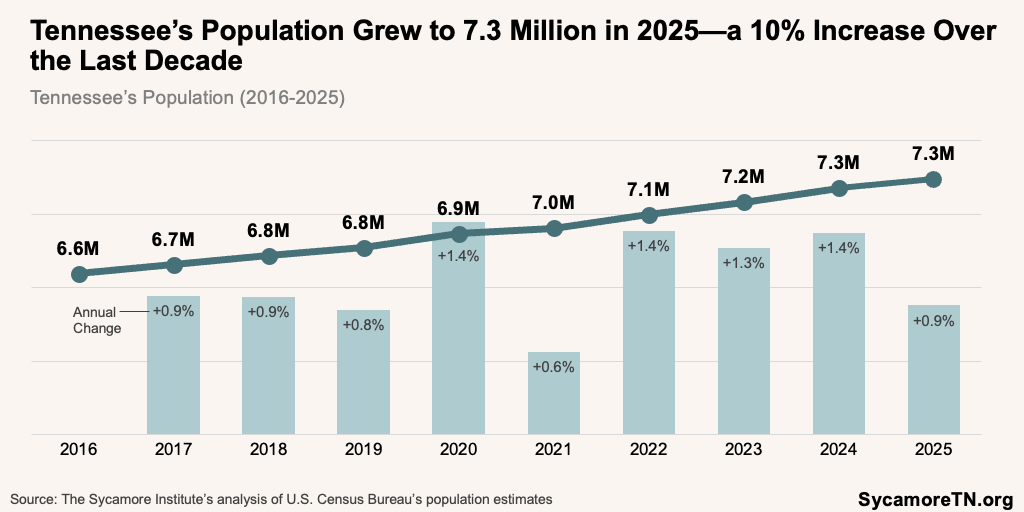
Figure 2
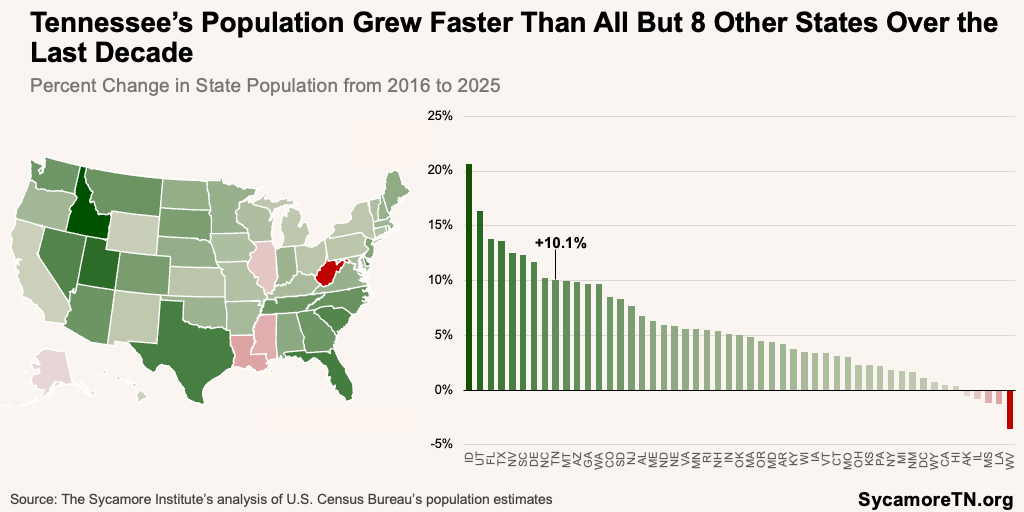
Figure 3
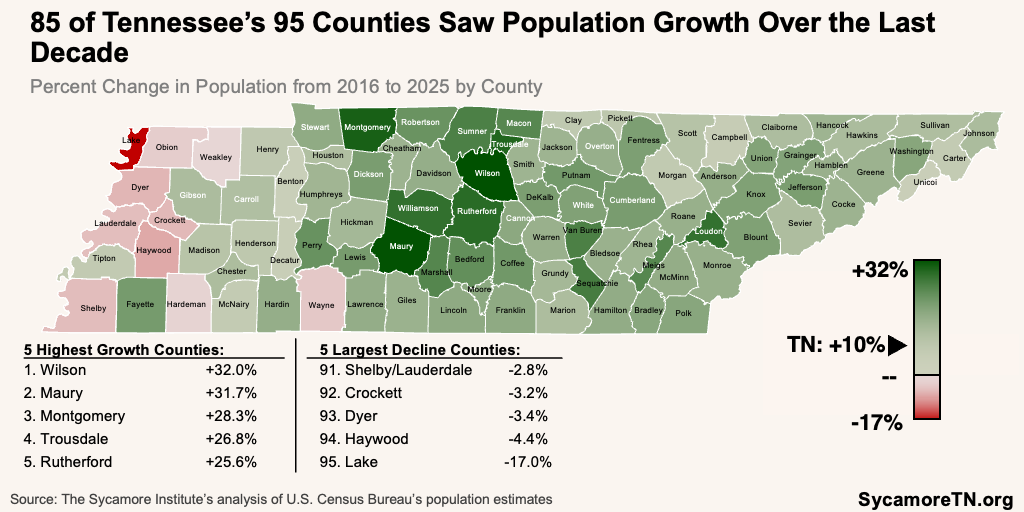
Figure 4
2. Although Tennessee is geographically rural, most people live in just a few urban areas.
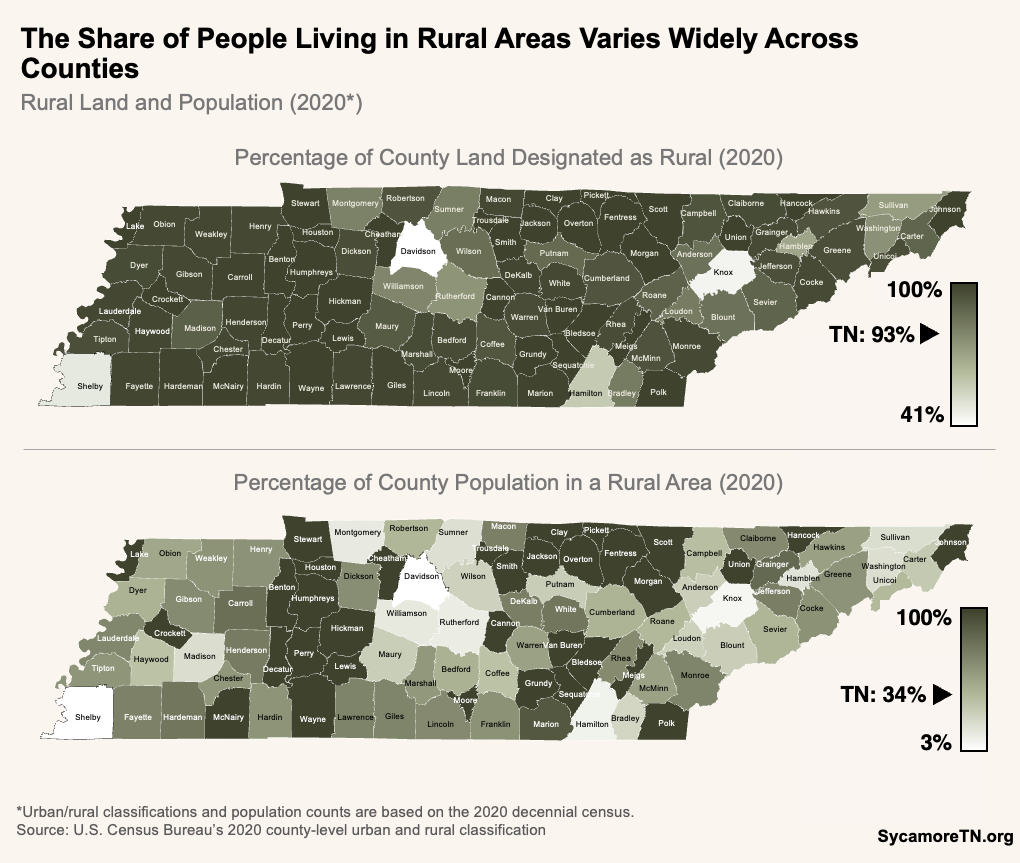
As of 2020, about 93% of Tennessee’s land area was classified by the U.S. Census Bureau as rural, but most residents—approximately 66%—lived in urban areas (Figure 5). (6) This means the state’s population is concentrated in a relatively small number of places. In 2025, for example, about 55% of Tennesseans lived in the state’s 10 most populous counties and one-third lived in its 10 largest cities (Figures 6 and 7). (7) (4) Outside these population centers, many counties are predominately or entirely rural. In fact, there were 32 counties in Tennessee in 2020 where all residents lived in rural areas, and 23 counties where fewer than half of residents did (Figure 8). (6)
Figure 5
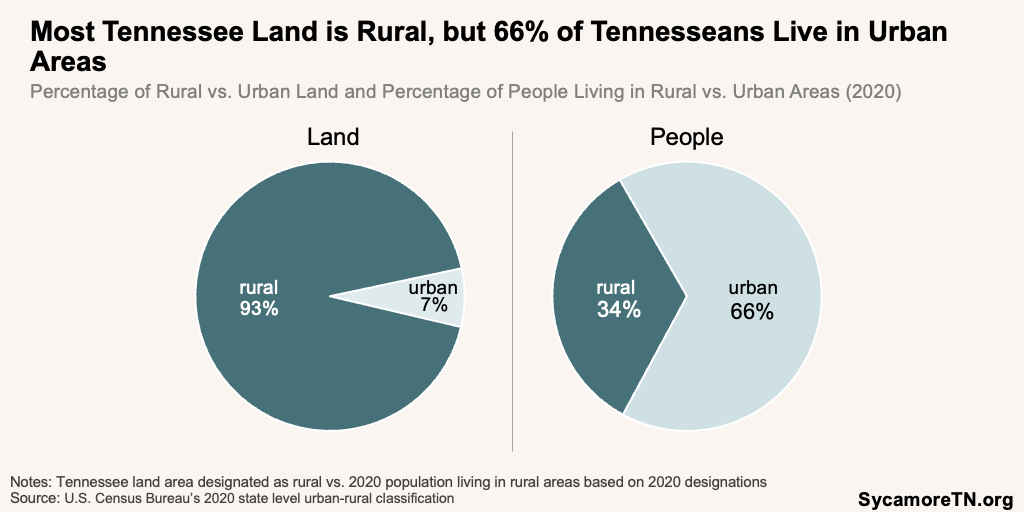
Figure 6
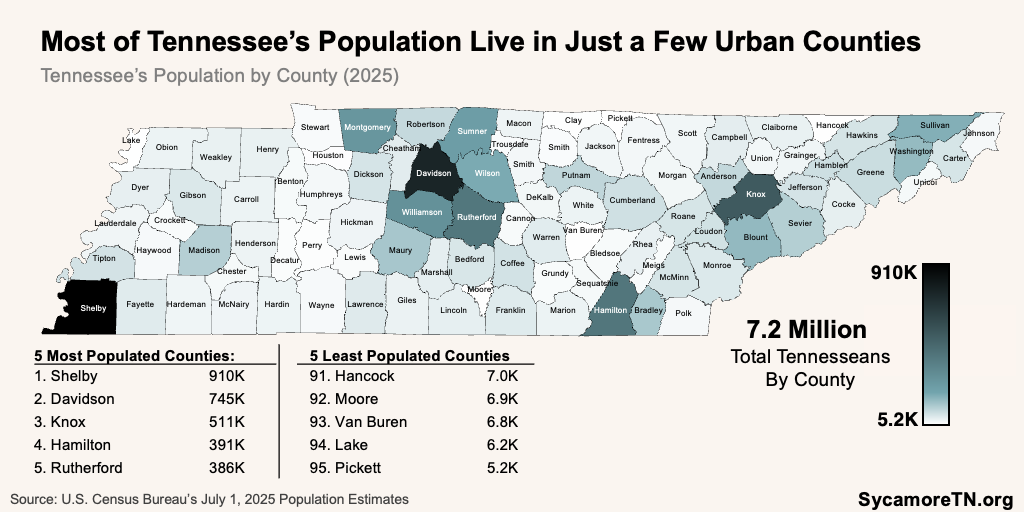
Figure 7
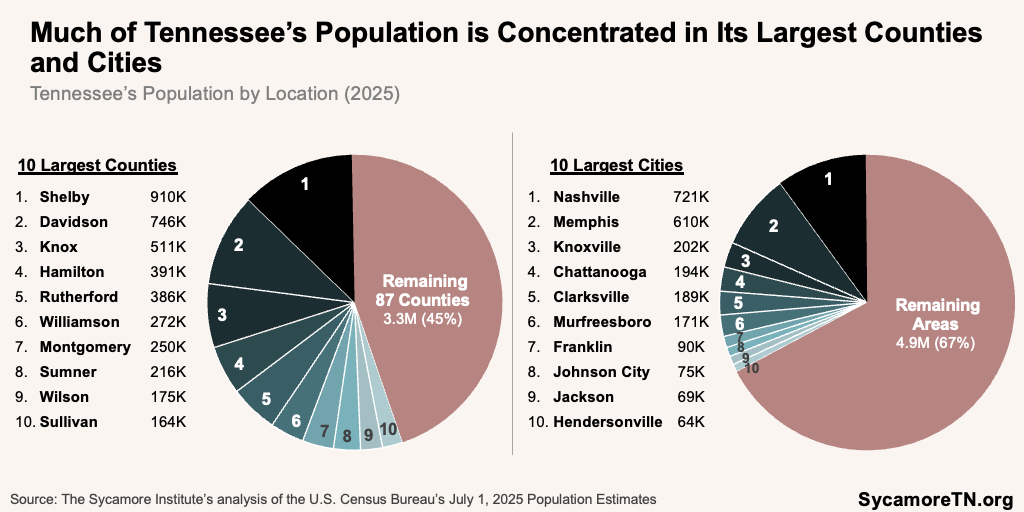
Figure 8
3. Tennessee’s population is aging.
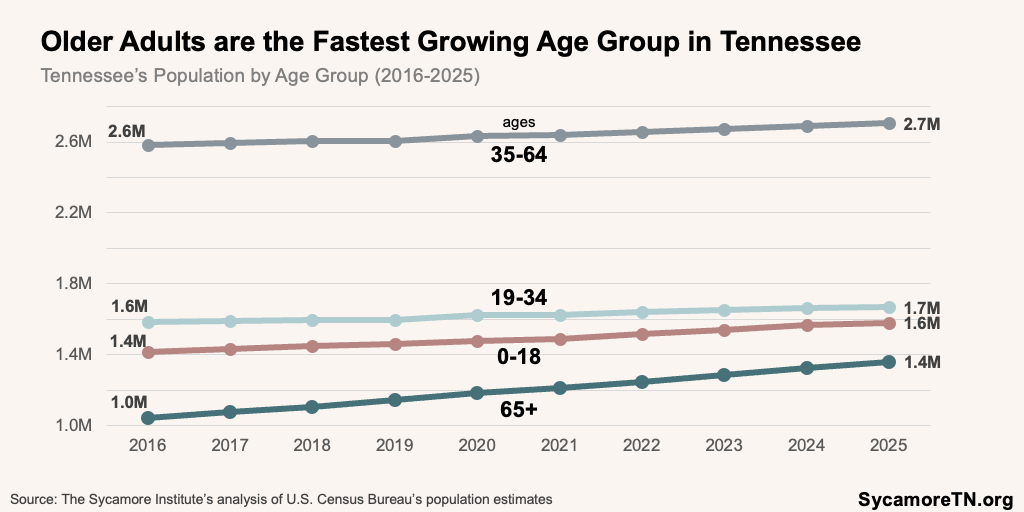
Over the past decade, the number of Tennesseans ages 65 and older has increased by 30%—faster than any other age group in the state (Figure 9). Between 2016 and 2025, this age group grew from 15.7% of the state’s population to 18.6%. (8) (9)
Figure 9
4. Tennessee’s population became more racially and ethnically diverse over the last decade, but these trends varied by location.
In 2025, about 70% of Tennessee’s population was white, non-Hispanic—a share that varied from 32.2% of Shelby County’s population to 95.4% of Scott County’s (Figure 10 and 11). About 15.2% of the state’s population was black, non-Hispanic—followed by Hispanic (8.6%), multi-racial, non-Hispanic (3.6%), and all other non-Hispanic races (2.6%). (9)
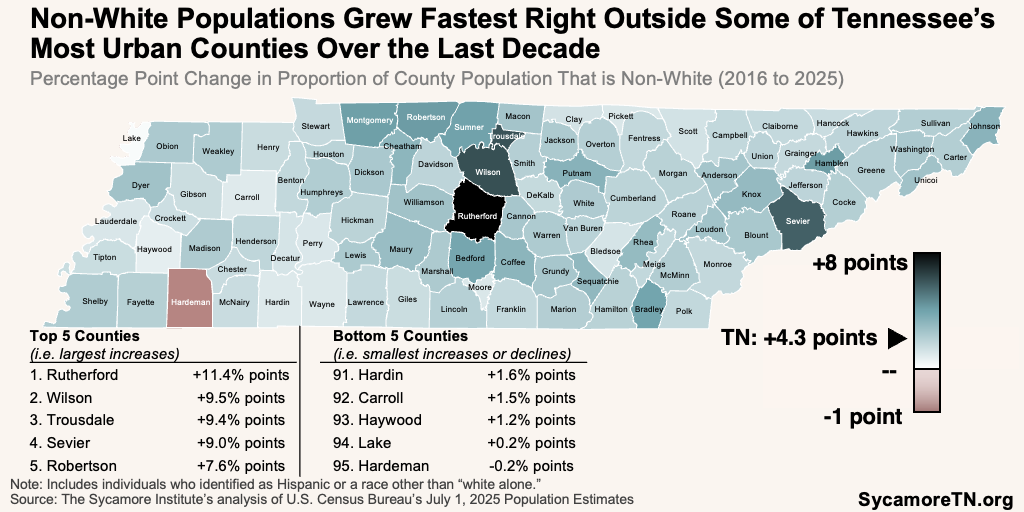
Over the past decade, the proportion of non-white individuals in Tennessee grew from 25.7% to 30%—a 4.3 percentage point increase. This trend is largely driven by growth in the number of individuals who are Hispanic and/or multiracial. Between 2016-2025, the largest percentage point increases in the proportion of the population that was non-white occurred just outside several of Tennessee’s most urban counties. For example, 27.9% of Rutherford Countians were a race or ethnicity other than white, non-Hispanic in 2025—compared to 39.3% in 2016—an 11.4 percentage point increase (Figure 12). (3) (4)
Figure 10
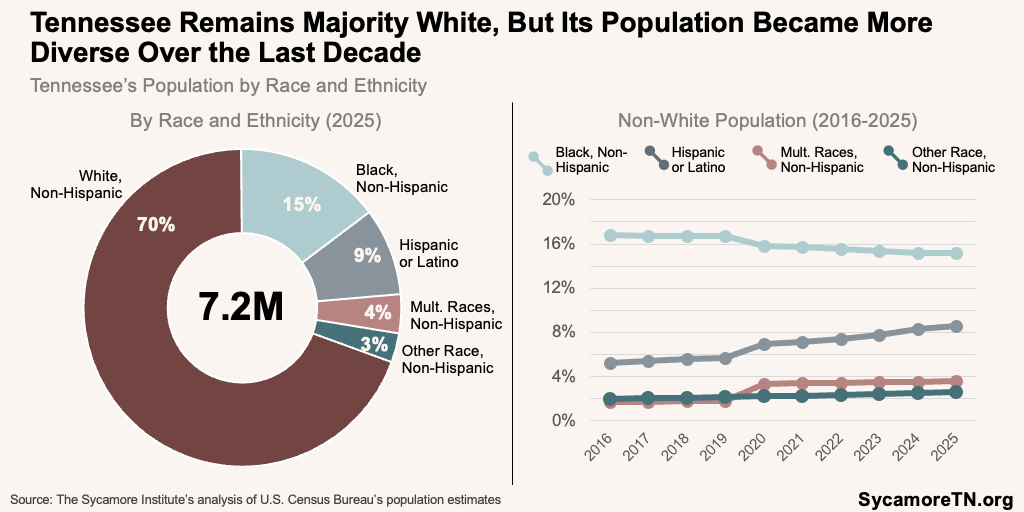
Figure 11
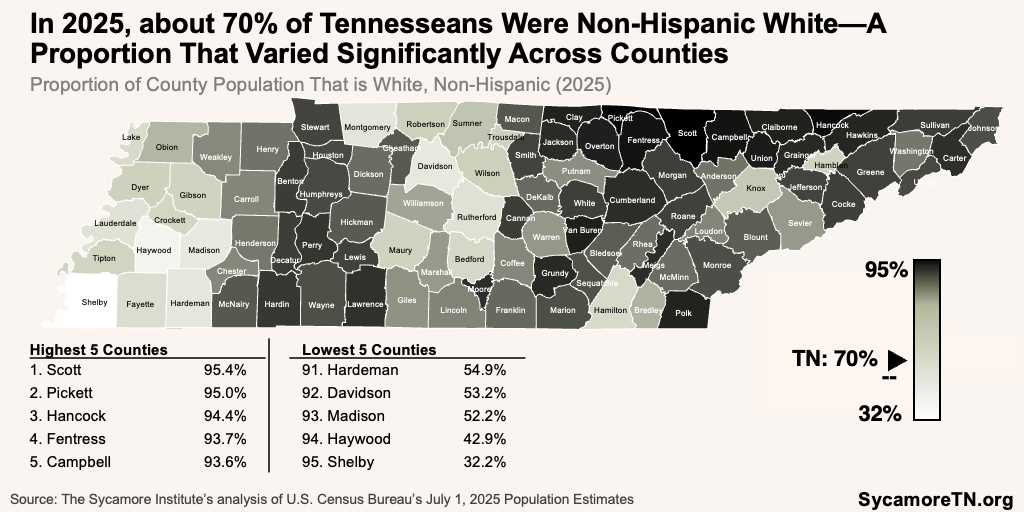
Figure 12
5. Population growth and demographic shifts come with policy implications.
Tennessee’s population growth and demographic shifts have policy implications for the state’s future. The state’s composition has changed over the past decade—marked by population growth, in-migration, an aging population, and increased racial and ethnic diversity. These trends shape demand for housing, infrastructure, workforce, and public services, with effects that vary based on local patterns and demographic characteristics. It will be important for policymakers to understand these population changes as they consider how to allocate resources, plan for future demand, and support communities with different needs across the state.
References
Click to Open/Close
References
- U.S. Census Bureau. State Population Totals: 2010-2020. [Online] Octiber 8, 2021. https://www.census.gov/programs-surveys/popest/technical-documentation/research/evaluation-estimates/2020-evaluation-estimates/2010s-state-total.html.
- —. State Population Totals and Components of Change: 2020-2025. [Online] January 2026. https://www.census.gov/data/tables/time-series/demo/popest/2020s-state-total.html.
- —. County Population by Characteristics: 2010-2020 . [Online] January 2022. https://www.census.gov/programs-surveys/popest/technical-documentation/research/evaluation-estimates/2020-evaluation-estimates/2010s-county-detail.html.
- —. County Population by Characteristics: 2020-2025. [Online] 2026. https://www.census.gov/data/tables/time-series/demo/popest/2020s-counties-detail.html.
- —. Methodology for United States Population Estimates: Vintage 2025. [Online] January 2026. https://www2.census.gov/programs-surveys/popest/technical-documentation/methodology/2020-2025/methods-statement-v2025.pdf.
- —. Urban and Rural. [Online] 2020. [Cited: June 23, 2026.] https://www.census.gov/programs-surveys/geography/guidance/geo-areas/urban-rural.html.
- —. City and Town Population Totals: 2020-2025. [Online] May 2026. https://www.census.gov/data/tables/time-series/demo/popest/2020s-total-cities-and-towns.html.
- —. State Population by Characteristics: 2010-2020. [Online] October 2021. https://www.census.gov/programs-surveys/popest/technical-documentation/research/evaluation-estimates/2020-evaluation-estimates/2010s-state-detail.html.
- —. State Population by Characteristics: 2020-2025 . [Online] June 2026. https://www.census.gov/data/tables/time-series/demo/popest/2020s-state-detail.html.
- —. Urban and Rural: County-level 2020 Census Urban and Rural Information for the U.S., Puerto Rico, and Island Areas sorted by state and county FIPS codes [10 MB]. [Online] September 2023. [Cited: December 12, 2024.] https://www.census.gov/programs-surveys/geography/guidance/geo-areas/urban-rural.html.