

Key Takeaways
- Under law, the state covers 70% of the TISA base and weight allocations. All local school districts together are responsible for the other 30%.
- Tennessee’s 95 counties contribute different amounts toward that 30% based on their fiscal capacity—a comparative estimate of how much local revenue they can potentially generate.
- The way Tennessee calculates local fiscal capacity is one of the most complex formulas in the country.
Tennessee’s state and local governments jointly fund K-12 education. In 2023, Tennessee adopted the Tennessee Investment in Student Achievement (TISA), the state’s public K-12 funding formula, which replaced the Basic Education Program (BEP). TISA revisited the BEP’s underlying assumptions about how much it costs to provide an adequate education to children, based on both student and school district characteristics. However, TISA preserved the state’s approach to determining how those costs are split with each individual school district based on calculations of what locals can afford to spend for themselves—known as fiscal capacity. This report explains how these aspects of TISA work today.
Education Funding’s 3 Core Questions
The TISA and fiscal capacity formulas together answer three core questions that determine how much money each school district receives from the state and how much locals must spend:
- Total Size of the Pie: What does it cost to provide an “adequate” education to every child in Tennessee?
- Total State/Local Split: How much of that total cost does the state cover, and how much do locals cover?
- District-Specific Split: How much does each specific district receive from the state?
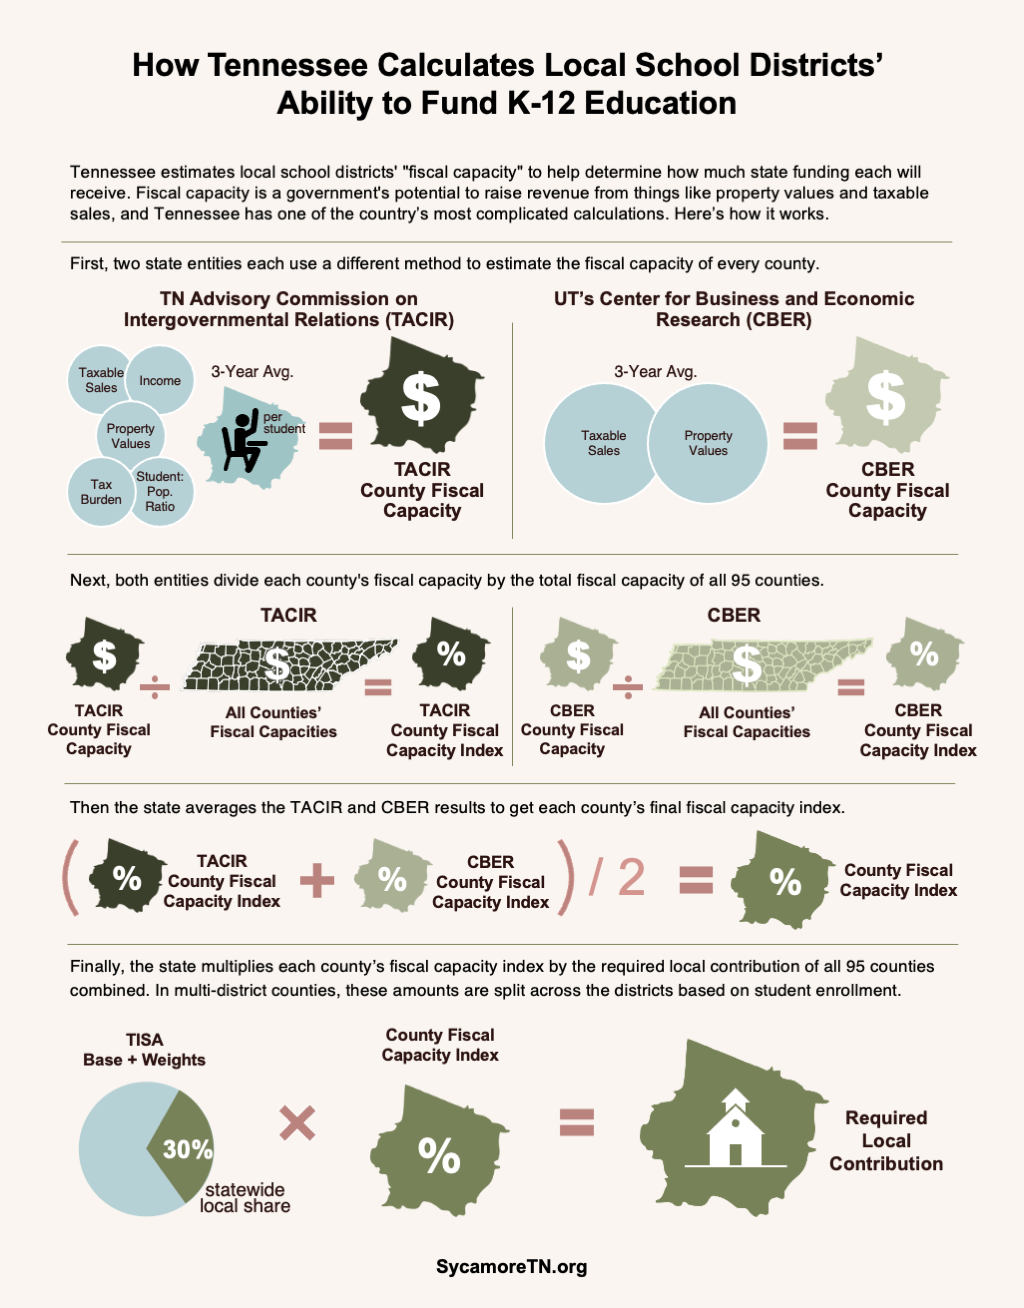
This policy brief focuses on questions two and three. We explain how TISA determines what share of K-12 education funding local school districts must contribute—both individually and in aggregate. We also highlight the considerations and challenges facing any effort to revisit Tennessee’s approach to fiscal capacity. For our purposes, the core TISA formula is the state’s answer to question one about the total amount of funding required. As a companion to the full report, Figure 2 and Textbox 2 present much of the same information using visuals and a simplified example, respectively.
Background and Challenges
Tennessee has one of the country’s most complicated methods of splitting the cost of K-12 education between the state and local governments. Later sections of this report explain the process in more detail. This section highlights some of the key factors that make our system so complex, along with comparisons to other states, trade-offs, and other important points to consider.
Multiple Models with a Large Number of Variables
Tennessee may be the only state that averages two calculations of local fiscal capacity—one of which uses a complex regression model based on a half dozen variables. This approach is hard for the average citizen to understand, especially when many other states use just a couple of variables like property values and income. On the other hand, Tennessee’s complex model may better capture the nuances of local fiscal capacity than simpler methods.
Figure 1
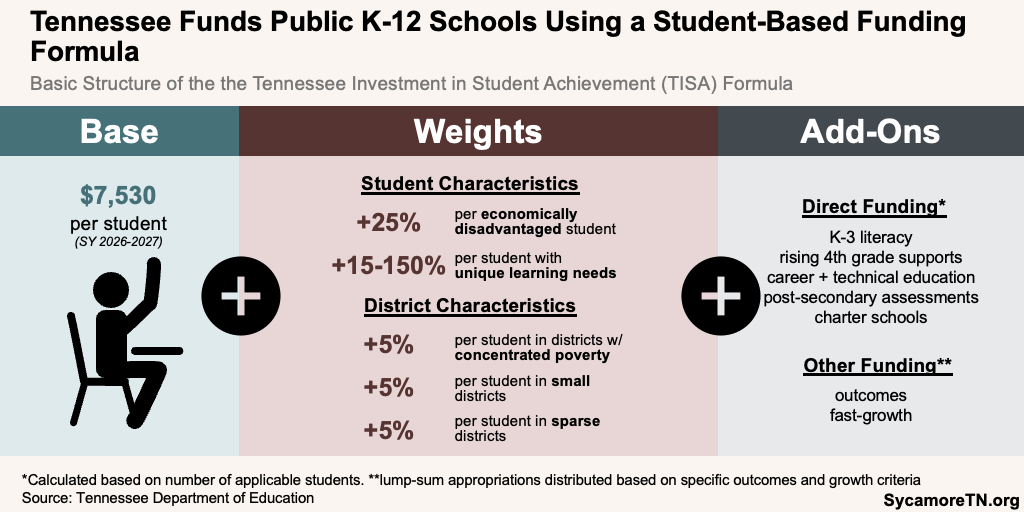
Figure 2
Prioritizing State or Local Stability
Tennessee’s aggregate state share of K-12 funding is set in law, while other states’ may vary from year to year based on local economic changes. Under TISA, the state covers 70% of costs generated by the fomula’s base and weights (Figures 1 and 2). The state applies a relative local fiscal capacity approach to determine how to distribute its share across districts each year. Alternatively, several other states use an absolute local fiscal capacity approach to determine state spending both in total and at the district level. An absolute fiscal capacity approach estimates what local districts can “afford” based on a required or assumed percentage of local resources, such as property taxes or sales taxes, to be set aside for education. (2) (3) (4)
Tennessee’s approach to local fiscal capacity provides stability for the state budget but may not be as responsive to swings in local economic conditions. Under Tennessee’s formula, the state share of education spending remains the same even if, for example, every district experiences a drop in local property values. One trade-off for local districts is the state’s share of spending is not responsive to widespread economic changes that may affect every district. Tennessee’s use of relative fiscal capacity combined with a fixed overall local share also means economic changes in one county can affect state funding for every district, even when those districts do not experience changes.
Counties vs. Districts
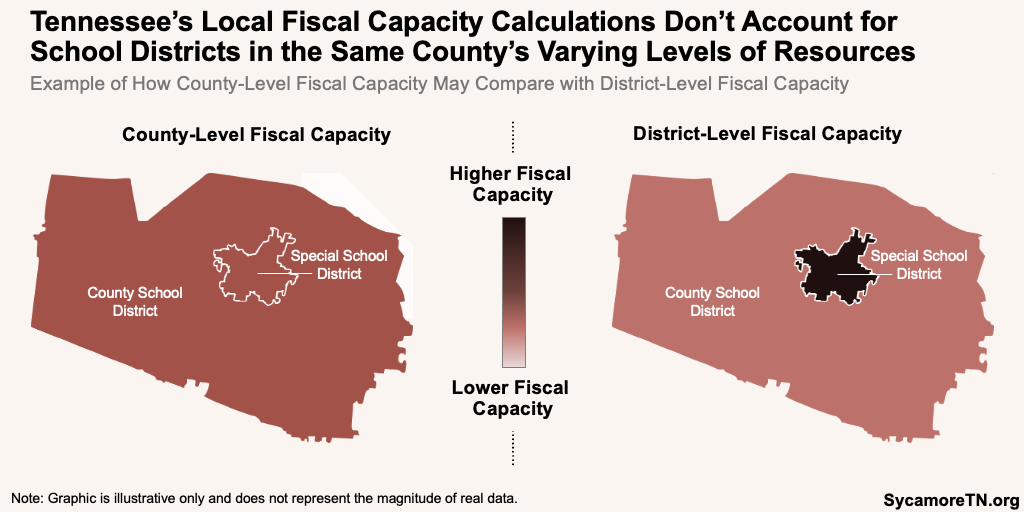
Tennessee calculates fiscal capacity at the county level, even when that county contains multiple school districts with different resources and student needs. (2) Under the current method, a city or special school district is assigned the same fiscal capacity as the entire county. If that district has more taxing potential than the other parts of its county, its assigned fiscal capacity will be artificially low and the rest of the county’s will be artificially high. As a result, the city or special school district gets more state funds and the remainder of the county less than if their fiscal capacities were calculated separately (Figure 3).
Figure 3
Winners and Losers
Any changes to how Tennessee approaches fiscal capacity may benefit some districts more than others. Over the years, policymakers have rolled back prior reforms or held districts harmless to prevent or ameliorate these redistributive effects. In 2016, for example, lawmakers halted the transition between two methods of calculating fiscal capacity—settling instead on a blend of both models. For similar reasons, lawmakers have set minimum funding levels to ensure no district receives less than it did in FY 2016. Actions like these reduce the negative financial impact on some districts but also undermine efforts to reduce funding inequities.
Textbox 1.
Note About Our Terminology and the Creation of the BEP/TISA
At times, this brief refers to the cost of an adequate or basic education. In context, these terms specifically mean the amounts generated by the TISA formula. They are based in the legal and conceptual reasons for the creation of both TISA and its predecessor the BEP, which are summarized below to help readers understand the origins of Tennessee’s current system. This wording does not refer to actual spending on education—nor is it a value judgment about the resources needed to sufficiently educate a child or children with different needs. Indeed, TISA’s creation stemmed from a widespread belief that the BEP did not reflect what it takes to adequately educate Tennessee children.
The TISA formula helps ensure Tennessee met its obligations under the state constitution to support a system of free public schools (Article XI, Section 12) and to provide equal protection of the laws (Article XI, Section 8 and Article I, Section 8). (14) (8) To satisfy these requirements, the state needs two things: a way to determine the cost of giving each student an adequate education and a plan to allocate funding between every school district. The TISA formula—and the BEP before it—serve both functions. The rest of this report focuses on how Tennessee uses TISA and fiscal capacity to meet its equal protection obligations.
How Tennessee Determines the State’s Overall Share of K-12 Funding
Tennessee law requires the state to cover 70% of the total TISA per-pupil base and weight calculations. (5) The state covers a greater share of costs under TISA than it did under the prior formula. BEP had four spending categories each with different aggregate splits that worked out to roughly 66%-34% state-local. (6) (7) (See the prior version of this report for a summary of the BEP’s overall funding split and its origins.)
How Tennessee Calculates Local Fiscal Capacity
To ensure every school district can provide a basic education no matter its resources, the state allocates its TISA dollars based on each district’s fiscal capacity. Due to differences in property values, incomes, the local economy, etc., some local governments can raise much more revenue per student than others. So, like most states, Tennessee looks at each county’s taxing potential to determine how much of the local school districts’ TISA costs it will pay.
Fiscal capacity is different than fiscal effort. Fiscal effort refers to the money counties actually raise to fund education and other local services. (5) Tennessee’s education funding formula does not consider local fiscal effort.
The Origins of Equalization
Local fiscal capacity was at the heart of the BEP’s creation in 1992. The BEP formula settled a years-long lawsuit in which 77 rural school districts challenged the state’s prior education finance system. In that case, the state supreme court ruled that Tennessee’s constitution requires the state to provide equal education opportunities to all students, regardless of economic differences that exist across counties and districts. Under the state’s old funding structure, only about 2% of education funding went to smooth out these differences—far too little to achieve that goal. (8) The school districts argued and the court agreed that the state’s financing scheme violated the state constitution by inadequately supporting children in districts with fewer resources. (9)
The practice of adjusting state funding by local fiscal capacity is often called equalization. If the state gave every district the same per pupil amount, wealthier districts could end up with much more per pupil funding than poorer districts due to their higher local revenues. In theory, equalization helps school districts with different revenue-raising potential to spend roughly the same amount per pupil on education. In reality, definitions of “equal” or “equitable” often vary. For example, some believe that equitable finance requires more spending on higher need students (which is one argument for a student-based formula). However, local spending disparities driven by differences in local willingness—rather than ability—to pay are also widely accepted under “equitable” funding schemes. (3)
How the Calculation Works
To estimate local fiscal capacity, Tennessee takes the average of two models. The University of Tennessee’s Center for Business and Economic Research (CBER) evaluates property values and taxable sales, which reflect local governments’ largest revenue sources. The Tennessee Advisory Commission on Intergovernmental Relations (TACIR) model is much more complicated. On top of property and sales tax revenues, it also attempts to capture factors like household income, the number of students per county resident, and the ability to export some taxes (e.g. sales taxes from out-of-county shoppers). The TACIR model was used exclusively until 2008, when the state began transitioning to the simpler CBER model. This transition stalled in 2016 when policymakers chose to stick with an average of both models. (10)
The key number for each county is its share of the total fiscal capacity of all 95 counties. To get that number, TACIR and CBER run separate calculations. First, they estimate how much revenue each county could raise per pupil using the models outlined above. Next, they sum every county’s results and adjust for the number of students to find the combined fiscal capacity of all counties. They then divide each county’s fiscal capacity by the statewide total. This number—the fiscal capacity index—represents a county’s share of all counties’ potential revenue. Finally, the state averages the TACIR and CBER indices to determine the state/local funding split in each county.
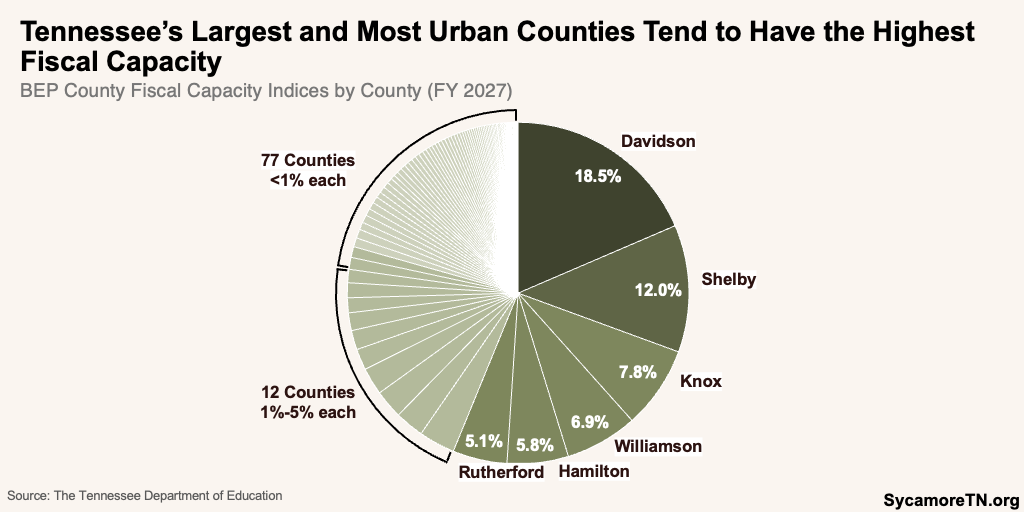
Generally, urban counties with higher incomes and more business activity have greater fiscal capacities than rural counties. Using the average of both models, for example, Davidson County had the highest fiscal capacity index at 19% and Hancock had the lowest at 0.03% (Figure 4). (11)
Figure 4
How Fiscal Capacity Determines State Funding for Each District
The amount of state funding each school district receives depends on the relative fiscal capacity of its county (Figure 2). For example, if a county has 10% of all 95 counties’ combined fiscal capacity—its fiscal capacity index—that county must contribute at least 10% of the total TISA costs required from all local governments (Textbox 2). Tennessee then subtracts each county’s required local contribution from its TISA calculation to determine its state funding. (1) In multi-district counties, the overall county numbers are split across each district based on student enrollment.
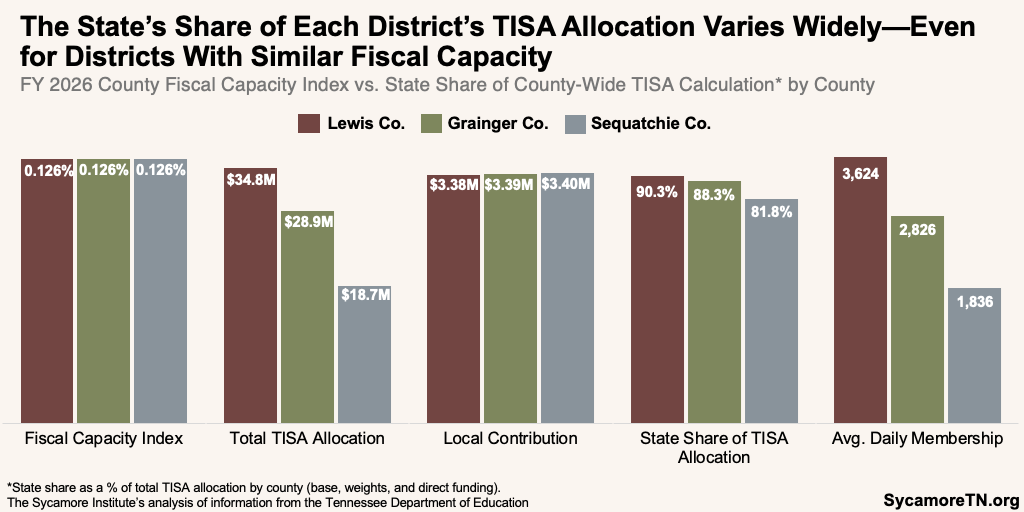
The state’s share of each individual district’s TISA calculation varies widely—even for counties with similar fiscal capacity (Figure 4). For example, Lewis, Grainger, and Sequatchie Counties all had a fiscal index of approximately 0.126% in FY 2026—resulting in required local contributions of about $3.4 million each towards their respective TISA allocations. Yet their total TISA allocations ranged from $18.7 million to $34.8 million, reflecting differences in student enrollment and characteristics. As a result, after accounting for the required local contribution, the state funded between 82% and 90% of each county’s total TISA allocation (Figure 5). This underscores that fiscal capacity is primarily a measure of how much a district can contribute toward TISA’s total statewide local funding requirement, rather than how much of its own TISA allocation it can cover.
Figure 5
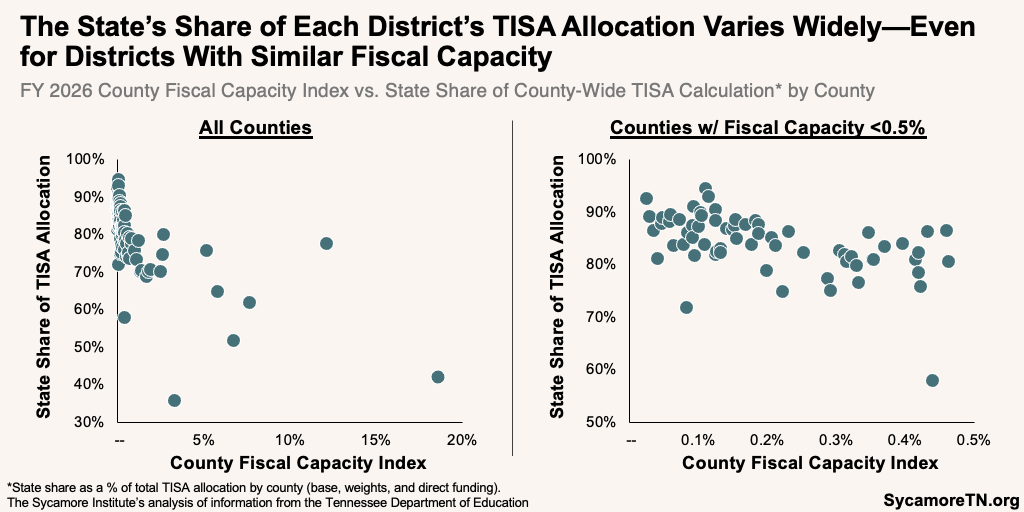
Figure 6
However, most districts spend more on K-12 education than TISA requires. In fact, TISA’s local maintenance of effort requirement generally requires local governments to maintain their local education spending levels from one year to the next. As a result, the actual ratio of state vs. local education funding is smaller than the TISA formula implies. Other bottom-line adjustments also affect the end result—including one adjustment to ensure districts receive no less funding than they did in FY 2026, outcomes bonuses, and stipends for districts experiencing fast growth. (1)
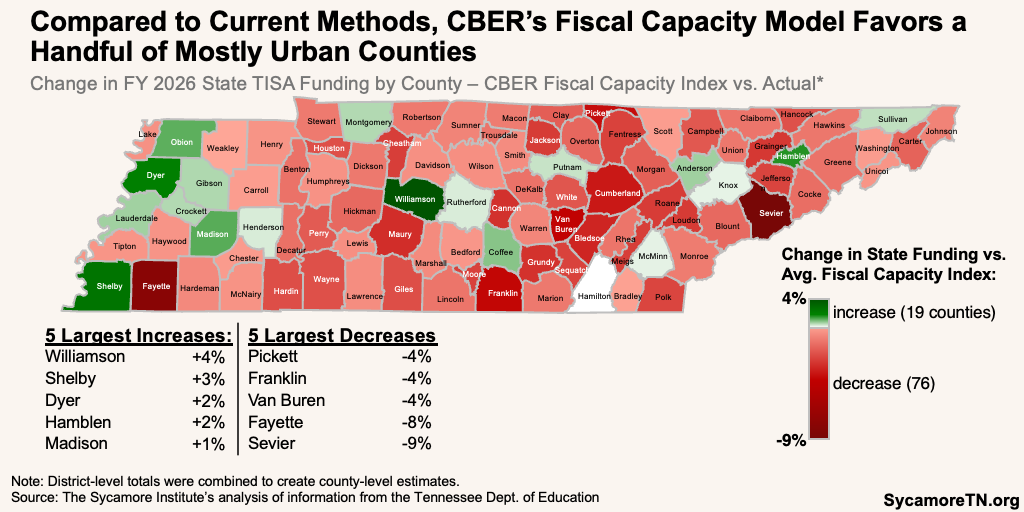
Because the two models used to estimate fiscal capacity create slightly different indices, they each allocate state dollars differently. Compared to the blended model currently in use, TACIR’s model would generally send more state money to the majority of school districts at the expense of a handful of mostly urban counties (Figure 6), while CBER’s model trends in the other direction (Figure 7). (13) (12)
Figure 7
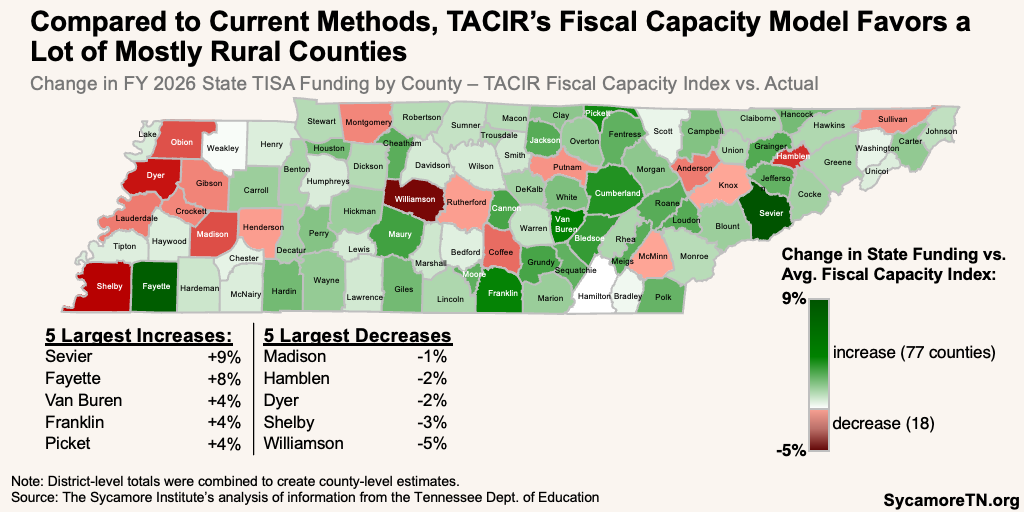
Figure 8
Parting Words
Fiscal capacity is ultimately about how Tennessee divides responsibility for funding K-12 education between the state and local governments. TISA establishes how much the state and local governments must contribute statewide, while fiscal capacity determines how that local responsibility is distributed across Tennessee’s counties. As result, decisions about how fiscal capacity is measured affect not only what individual communities are expected to contribute but also how state education dollars are distributed across school districts. There is no inherently right or wrong way to do that, but any approach involves trade-offs. Understanding those trade-offs is essential to evaluating whether Tennessee’s current system reflects policymakers’ goals for funding public education.
Textbox 2.
How Fiscal Capacity Affects State Funding for Local Districts:
A Simplified Example
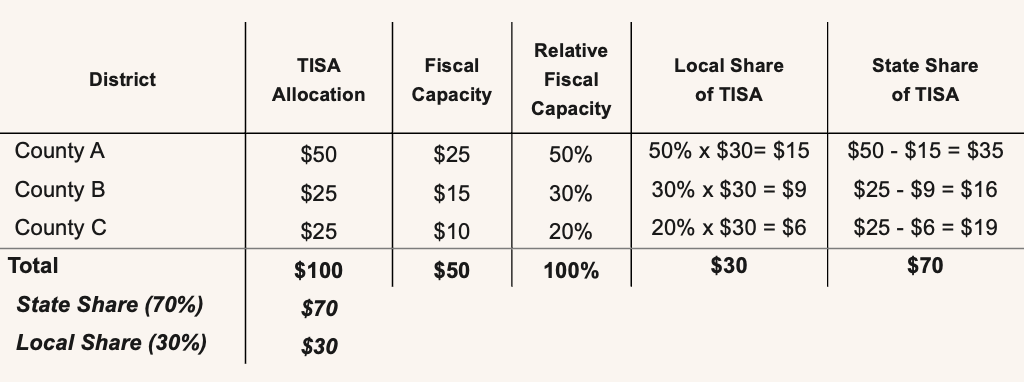
Imagine TISA estimates it would cost $100 to fund K-12 education this year statewide, based on TISA’s base and weights and expected student enrollment and characteristics in each district. Per Tennessee law, the state would contribute $70 and localities $30.
Let’s say there are three countywide school districts in the state. The TISA formula calculates the cost of giving every student an adequate education at $50 for County A, $25 for County B, and $25 for County C. Altogether, these three counties could raise an estimated $50 in local revenues – with 50% coming from County A, 30% from County B, and 20% from County C.+
In this scenario, TISA requires County A to contribute $15, County B $9, and County D $6 or 50%, 30%, and 20% of the total statewide local share, respectively. The state would then cover the rest of each County’s TISA calculation—$35 for County A, $16 for County C, and $19 for County C.
+ The actual formula uses the average of two different calculations to arrive at these percentages.
References
Click to Open/Close
- Tennessee Department of Education . 2026-27 TISA Guide. [Online] 2026. https://www.tn.gov/content/dam/tn/education/tisa-resources/2026-27_TISA_Guide.pdf.
- Tennessee State Collaborative on Reforming Education (SCORE). Modernizing Education Funding to Support Every Tennessee Student. [Online] 2022. [Cited: February 15, 2022.] https://tnscore.org/wp-content/uploads/2022/01/Modernizing-Education-Funding_2022_digital_FINAL.pdf.
- Skinner, Rebecca. State and Local Financing of Public Schools. Congressional Research Service. [Online] August 26, 2019. https://www.everycrsreport.com/files/20190826_R45827_7a8d531e7ae1e7fabafeffb87cdfd1b3d03ced49.pdf.
- EdBuild. A National Overview of State Education Funding Policies. FundEd: National Policy Maps. [Online] 2022. [Cited: February 15, 2022.] http://funded.edbuild.org/national#local-share.
- State of Tennessee. Tenn. Code Ann. § 49-3-109. Accessed via Lexis.
- Tennessee Comptroller’s Office of Research and Education Accountability. FY 2019 BEP Calculator. [Online] February 16, 2022. Accessed from https://comptroller.tn.gov/office-functions/research-and-education-accountability/interactive-tools/bep.html.
- —. Basic Education Program. [Online] [Cited: February 18, 2022.] https://comptroller.tn.gov/office-functions/research-and-education-accountability/interactive-tools/bep.html.
- Supreme Court of Tennessee. Opinion in Tennessee Small School Systems vs. McWherter. [Online] March 22, 1993. [Cited: February 13, 2022.] Accessed via https://www.casemine.com/judgement/us/5914bea5add7b049347a9700.
- Hurder, Alex J. Tennessee Small School Systems v. McWherter. Tennessee Encyclopedia. [Online] October 8, 2017. [Cited: February 12, 2022.] http://tennesseeencyclopedia.net/entries/tennessee-small-school-systems-v-mcwherter/.
- Tennessee Advisory Commission on Intergovernmental Relations (TACIR). County Fiscal Capacity for FY 2021-FY 2022. [Online] October 11, 2021. [Cited: February 9, 2022.] https://www.tn.gov/content/tn/tacir/fiscal-capacity-for-education/information-for-tennessee-counties/county-fiscal-capacity-for-fy-2021-fy-2022.html.
- Tennessee Department of Education. FY 2027 County Fiscal Capacity Calculations. [Online] 2026. [Cited: August 7, 2026.] https://www.tn.gov/content/dam/tn/education/tisa-resources/FY27_County_Fiscal_Capacity_Calculations.pdf.
- —. FY 2025-26 TISA Final Allocations. [Online] August 15, 2025. https://www.tn.gov/content/dam/tn/stateboardofeducation/documents/2025-sbe-meetings/august-15%2c-2025-sbe-meeting/8-15-25%20II%20C%20FY%202025-26%20TISA%20Allocations%20Attachment.pdf.
- —. FY 2026 County Fiscal Capacity Calculations. [Online] 2025. [Cited: August 10, 2026.] https://www.tn.gov/content/dam/tn/education/tisa-resources/FY26_County_Fiscal_Capacity_Calculations.pdf.
- State of Tennessee. The Constitution of the State of Tennessee . [Online] November 4, 2014. https://www.capitol.tn.gov/about/docs/tn-constitution.pdf.