Key Takeaways
- Housing is a key driver of individual and family well-being and an important component of thriving communities.
- Economic Security and Growth — Housing affordability and location can have far-reaching effects on household financial security and communities’ economic competitiveness.
- Health — Physical housing conditions, housing affordability, and a community’s resources and conditions can affect health outcomes.
- Transportation — The location and availability of attainable housing closely links to transportation, transportation costs, traffic congestion, and the demand for mobility options.
- Education — The city and community where a home is located often determines the educational opportunities available to a child.
- Regional and Spillover Effects — Housing deficiencies in one market can have consequences for an entire region.
- Local Finance — Housing has many implications for local government finances—including property taxes and the costs of and demand for local infrastructure.
- Civic Life and Social Capital — Homeownership, a home’s community, and the housing options in those communities can have implications for civic life and social capital.
- Energy and the Environment — Housing construction and characteristics also have connections to utility costs, agricultural and natural land, and the environment.
- Low-income and minority neighborhoods tend to have features associated with less opportunity and worse outcomes—many of which were areas isolated by past housing policies.
Housing is an important driver of economic security and well-being, but many Tennesseans struggle to afford a home in their community. Meanwhile, policymakers at all levels of government are increasingly looking for ways to address these issues. This report explores the connections between housing and economic security and growth, health and safety, transportation, and education for both individuals and communities. It also explores the potential regional impacts, implications for local government finances, and past housing policies’ role in shaping housing today.
Background
Housing is a basic necessity. A home provides shelter, safety, and privacy. It supports life’s core activities—sleeping, cooking, personal hygiene—and is often necessary for participation in civic society. For example, you need a permanent address to get a driver’s license, vote, open a bank account, receive mail, and qualify for many forms of public assistance. (1) (2) (3) (4) (5) (6)
Figure 1
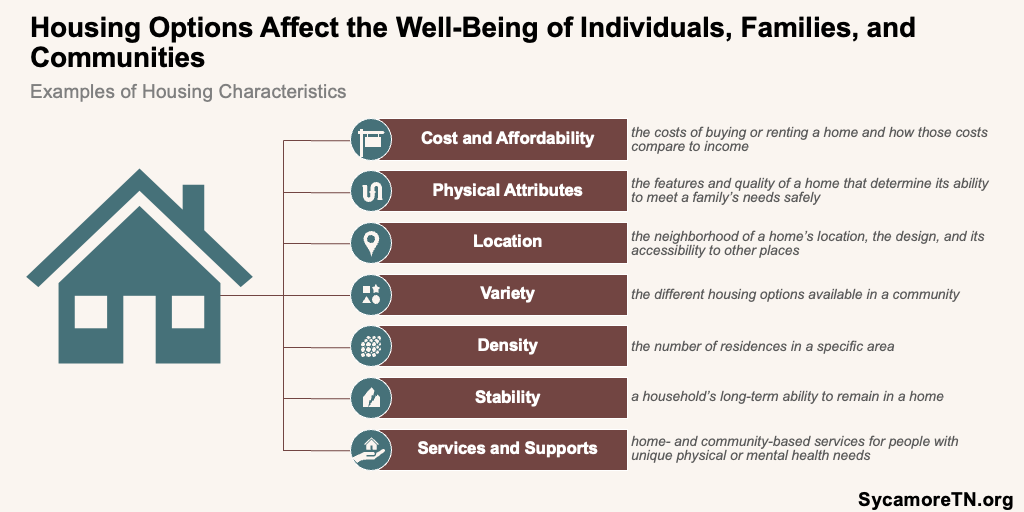
Housing options and the characteristics of those options affect the well-being of individuals, families, and communities. These features are often interrelated and reinforcing and include (Figure 1):
- Costs and Affordability — The costs of buying or renting a home, home insurance, repairs, maintenance, utilities, and property taxes and how those costs compare to income.
- Physical Attributes — The features and quality of a home that determine its ability to meet a family’s needs safely.
- Location — The neighborhood of a home’s location, the design, and its accessibility or proximity to stores, schools, work, and other amenities.
- Variety — The housing options available in a community—including type, size, and cost.
- Density — The number of residences in a specific area—typically measured as the number of dwelling units per acre.
- Stability — A household’s long-term ability to remain in a home, which affordability, eviction, forced moves, and homelessness can threaten. (7)(8)
- Services and Supports — Home-based services that help people with unique physical or mental health needs to live in the community.
Figure 2
Financial Security and Economic Growth
Housing affordability and location can have far-reaching effects on household financial security and the economic competitiveness of communities.
Household Financial Security
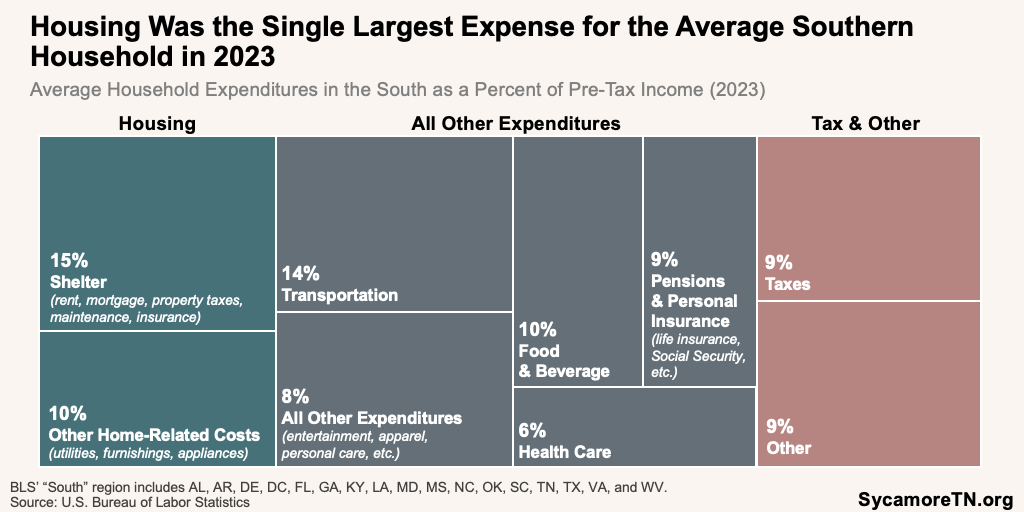
Housing is usually a household’s single largest expense (Figure 2). Regional housing supply, demand, and features like size, location, age, and physical quality determine housing prices. (10) Other costs may include home insurance, mortgage interest, maintenance and repairs, utilities, property taxes, and modifications necessary to meet new needs or building codes. Homeowners face these costs directly, while they are also passed onto renters through higher rents.
Because of its role in household budgets, housing is a key factor in a family’s financial security. For most families, housing costs determine what remains for life’s other expenses. (9) Families must decide how to balance the costs of housing with other necessities like food, transportation, and health care. When households spend more than 30% of their income on housing, they are considered “cost-burdened.” In 2023, an estimated 28% of Tennessee households were cost-burdened—including 49% of renters, 25% of homeowners with a mortgage, and 11% of homeowners without a mortgage (Figure 3)—proportions that varied significantly across the state and within communities (Figure 4). (11)
Figure 3
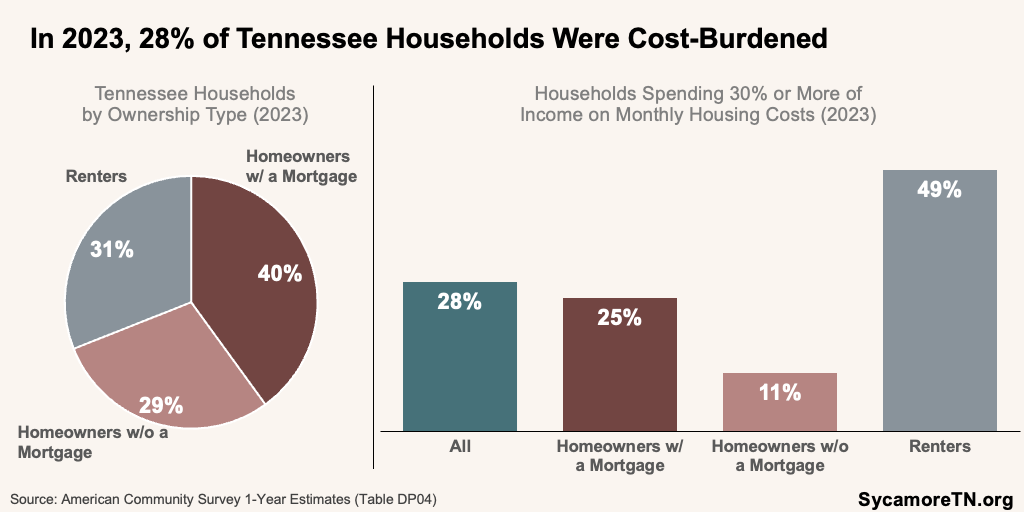
Figure 4
Housing can also affect economic mobility. People may be more hesitant to move to areas with more job opportunities if the housing prices in those areas are too high. (12) A home’s neighborhood may also affect opportunities for upward mobility—like school quality, socioeconomic diversity, and transit access. (13)
Figure 5
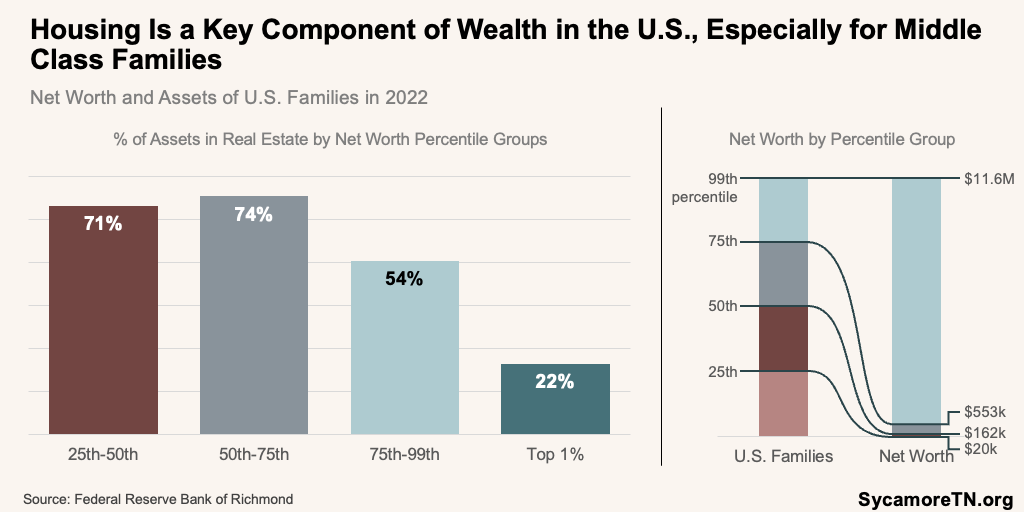
Figure 6
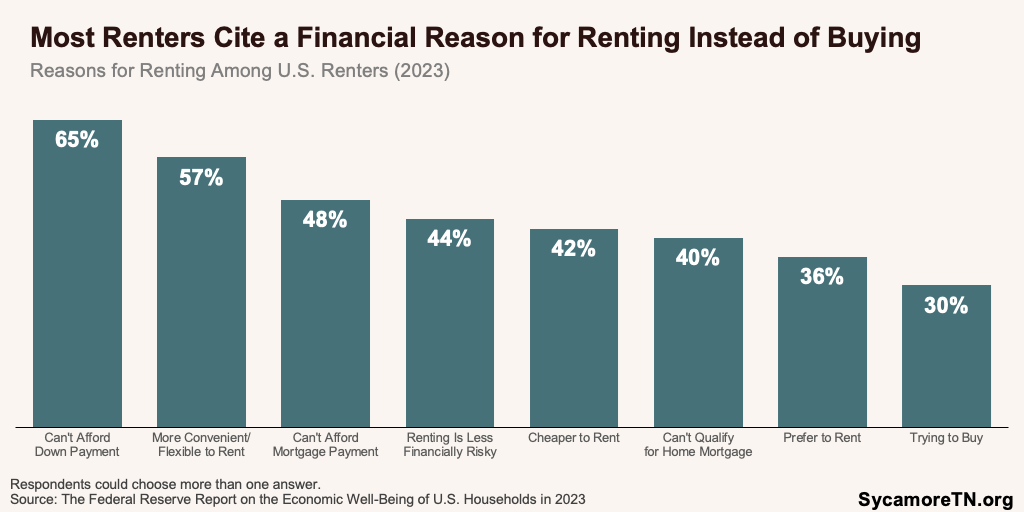
Housing can be a key component of or barrier to building wealth in the United States—especially for middle class families. (16) Real estate was the largest asset for most middle-net-worth families in the U.S. in 2022 (Figure 5). When housing costs are attainable, families can buy a home—an asset with stable long-term housing costs, the opportunity to build equity, increased credit access, and the ability to pass something on to future generations. However, high rent can stand in the way of saving for a future home’s down payment, and high purchase prices can put homeownership out of reach for some. In fact, most American renters cite at least one financial reason for renting instead of owning (Figure 6). (15) For renters and homeowners, high housing costs can crowd out other investment opportunities that may help families plan for retirement or provide other pathways to multi-generational wealth.
Housing instability can affect employment. Those who experience evictions and homelessness have been shown to be more likely to lose their job or have a harder time finding a job. Reasons may include the inability to take time off to deal with legal proceedings or lack of access to the identification documents needed for employment. (17) (18) (19) (20)
Community Economic Competitiveness
Discrepancy between the location of jobs and the employees needed to fill those jobs can slow economic growth and productivity. An area’s housing stock can stifle job growth if the housing supply is not responsive enough to accommodate the needed workforce. When this happens, workers may live further away from their jobs or find new employment to afford a house that meets their needs. As a result, businesses may struggle to fill open positions and experience more turnover and less worker productivity from the physical and mental health effects of longer commute times. High housing costs also increase the demand for higher wages, driving up business costs. Many issues associated with spatial mismatch are even more pronounced for lower-wage workers who are more sensitive to housing and transportation costs. (21) (22) (23) (24) (25) (26) (27) (28) (29) (30) (31) (32)
Figure 7
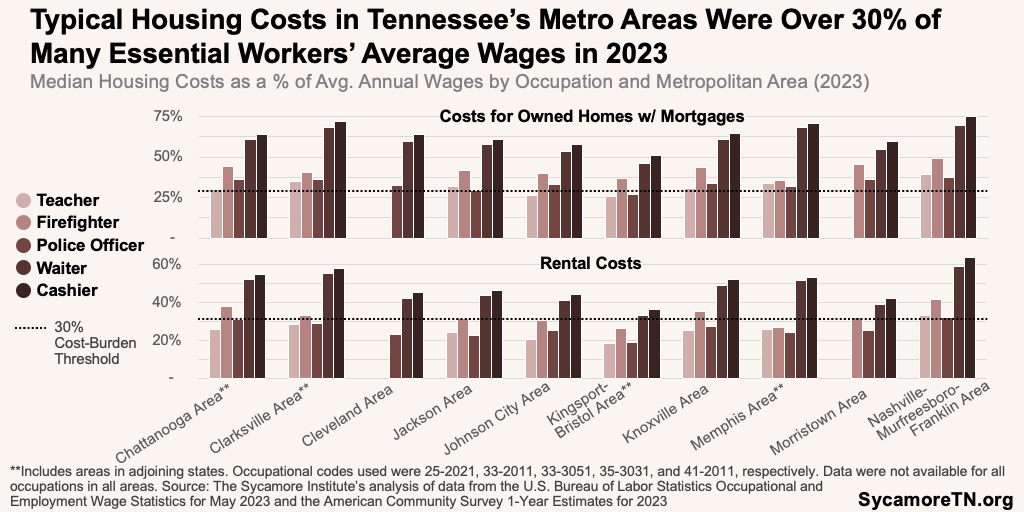
Data suggest that many parts of Tennessee lack sufficient housing options at price points needed to attract and maintain a broad and competitive workforce. For example, communities throughout the state need teachers, police, and service industry employees. However, the typical housing costs in 2023 were more than 30% of average wages for many of these jobs in Tennessee’s metro areas (Figure 7). (33) (11)
These factors can play a role when some businesses look to relocate or expand. When making these decisions, companies typically consider an area’s labor market potential. If the business’ wages can’t comfortably cover housing costs in an area, that may affect its ability to recruit and retain employees. (21) In fact, some companies are considering a return to corporate housing and other ways to subsidize housing for employees to address current shortages. (34)
Health and Safety
Housing Stock
Physical housing conditions can affect health outcomes—especially for children. (17) (35) (36) (37) For example, poor air quality, inadequate ventilation, extreme temperatures, and high humidity can trigger health issues like asthma, fatigue, headache, dizziness, poor sleep, and an increased risk of cancer. (38) (39) (40) (41) Issues such as rodent or insect infestations, excessive moisture and mold, exposure to lead or other hazardous elements, and unsafe or disconnected utilities can cause illness and injury. (17) (42) (40) Poor quality housing can also contribute to adverse mental health by increasing levels of stress, anxiety, and depression. (12) (14) (15) In addition, the physical attributes of a home (e.g., poor lighting, uneven flooring, access to railings and grab bars) can expose aging adults or those with disabilities to falls or other accidents that can lead to injury or death. (43)
High housing costs can also contribute to poor health. As families balance housing expenses alongside other expenditures, they may face challenges that affect health, including:
- Financial Trade-Offs – Choosing between paying for housing and affording quality food, health care, or other essentials necessary to maintain health. (37)
- Poor Home Quality – Lower-income families are more likely to live in substandard housing that meets their budgets but may have one or more of the quality issues outlined above. (37)
- Deferred Maintenance – Delaying essential but costly maintenance may expose a household to health and safety hazards.
- Overcrowding – An inadequately-sized home may lead to increased stress, reduced privacy, and more illness.(17)
- Instability and Homelessness – Housing instability creates hardship that increases stress and makes it difficult for individuals to manage their health.(17) Temporary or long-term homelessness, for example, can compound issues of instability, leading to chronic health problems and greater use of costly emergency services instead of preventative care. Housing insecurity in childhood can also affect long-term physical and mental health. (44)
Community Factors
The community and neighborhood surrounding a home influence health. (52) (37) Areas without essential resources and safe conditions expose residents to or increase their risk for adverse health outcomes. A household’s access to resources and exposure to factors that affect health can vary significantly across neighborhoods in the same city or community, including:
- Access to Healthy Foods — According to the most recent federal estimates, 27% of Tennesseans lived more than a mile in urban areas or 10 miles in rural areas from a grocery store in 2019 (Figure 8). (45)(46) People with limited access to affordable and healthy food are at higher risk of poor nutrition and nutrition-related chronic diseases. (53) (54) (55)
- Recreational Opportunities — In 2020, about 34% of Tennesseans lived within a half mile of a publicly-accessible park, and about 53% lived within a mile—a proportion that varied significantly even within communities (Figure 8).(47) Access to sidewalks and recreation like parks, nature centers, trails, and outdoor activities creates opportunities for physical activity and is associated with better mental and physical well-being. (56) (57) (58) (59)
- Crime — Neighborhood crime and violence exposes residents to harm, and the stress associated with exposure to violence negatively impacts healthy physical activity and mental health—especially among children. Witnessing violent crime is considered an adverse childhood experience that can trigger toxic stress and affect healthy brain development. (60) (61)(62)
- Transportation Accessibility — Issues like local transportation infrastructure and workplace proximity can affect health. Accessible transportation systems and options can make it easier for individuals to get medical care and provide other opportunities to stay healthy, especially for those with more frequent health needs. (63) (64) Meanwhile, sedentary time commuting alone—especially 30 minutes or more—has been linked to higher blood pressure, obesity risk, poorer mental health, and less physical activity. (65) (66) (67) (68) (69)
- Hazardous Infrastructure — Some communities may have older public infrastructure that can pose health risks. For example, lead water lines can contaminate drinking water.(70) Lead exposure is particularly harmful to children and can affect the brain and nervous system, growth and development, and learning and behavior. (71) The U.S. Environmental Protection Agency recently estimated that about 13% of Tennessee’s water lines may contain lead—the 14th highest proportion across the U.S. (72) Meanwhile, a statewide lead service line inventory is currently underway that will provide a more accurate estimate. (73)
- Pollution — Proximity to air, water, and ground pollutants from commercial properties or noise pollution from nearby transportation can result in negative health effects. (74) (75) (76) (77)
- Extreme Heat — There is wide variation in the frequency of extreme heat within communities because of factors like tree coverage and the amount of paved, heat-absorbing surfaces.(78) For example, in Nashville from 2019-2023, the average number of days with temperatures over 90 degrees varied from 22 days in parts of southwest Davidson County to 32 in the downtown core (Figure 8). (48) (49) Extreme heat can trigger related illnesses like heat exhaustion or heat stroke—particularly for older adults, children, and individuals with certain chronic conditions. (79) (80) (81) Between 2017 and 2022, extreme heat was linked with 76 deaths in Tennessee, over 950 hospitalizations, and about 10,000 emergency department visits. (82)
-
- Other Natural Hazards — Some places are at higher risk for natural hazards. According to the Federal Emergency Management Agency (FEMA), about 11% of Tennesseans live in an area designated as being at high risk for at least one of 18 natural hazards (Figure 8)—including tornadoes, earthquakes, heat waves, winter weather, and riverine flooding.(50) (51) These hazards can contribute to weather-related death, exacerbate underlying illnesses, or amplify the negative effects of existing air pollutants. (83)
Figure 8
Access to services and supports in the home or community can also help some individuals with unique physical or behavioral health needs maintain stable housing. For example, home and community-based services include medical and non-medical supports that help older adults and individuals with disabilities live independently in their homes and communities instead of institutions. (84) (85) (86) (87) Meanwhile, supportive housing approaches often combine subsidized housing with an even more intensive level of services. These programs usually target those needing inpatient- or institutional-level care to maintain stable housing. Targeted populations include individuals with substance use disorders, mental illness, and/or disabilities, older adults, chronically homeless adults, and/or veterans, among others. (88) (89) (90) (91)
Transportation and Infrastructure
The location and availability of attainable housing closely links to transportation. (92) (93) For example, commute times and car expenses are directly linked to the proximity of housing to work and other necessities, housing density, and nearby transportation options and infrastructure. (94) (95)
Transportation is most families’ second largest household expense (Figure 2), and those costs often factor into housing affordability analyses. (94) (95) (96) (97) Transportation costs can be particularly high for lower-income or rural individuals. In 2023, for example, households nationally spent about 12.9% of pre-tax income on transportation costs—compared to 15.0% for rural areas and 31.5% for those with incomes in the bottom one-fifth. (98) (99) Sometimes, transportation costs are higher where housing is more affordable—often farther from centers of work and commerce. Because of that, housing and transportation costs are often considered together to understand housing affordability better in Tennessee and nationally. (92) (100)
Figure 9
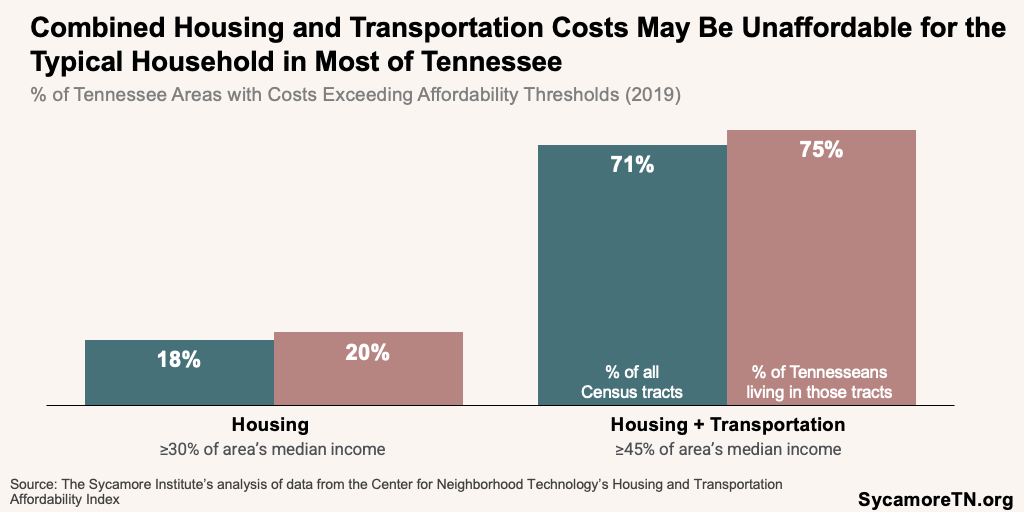
Figure 10
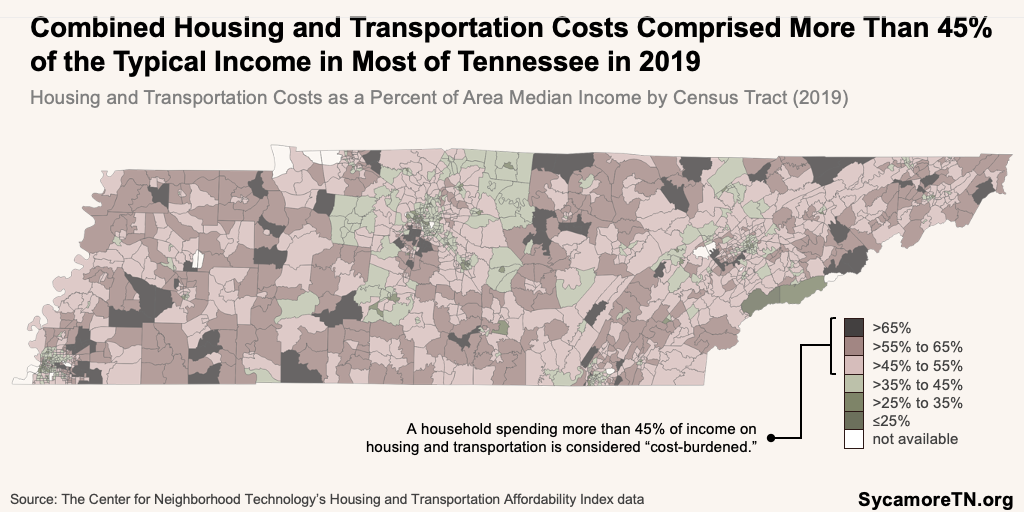
Figure 11
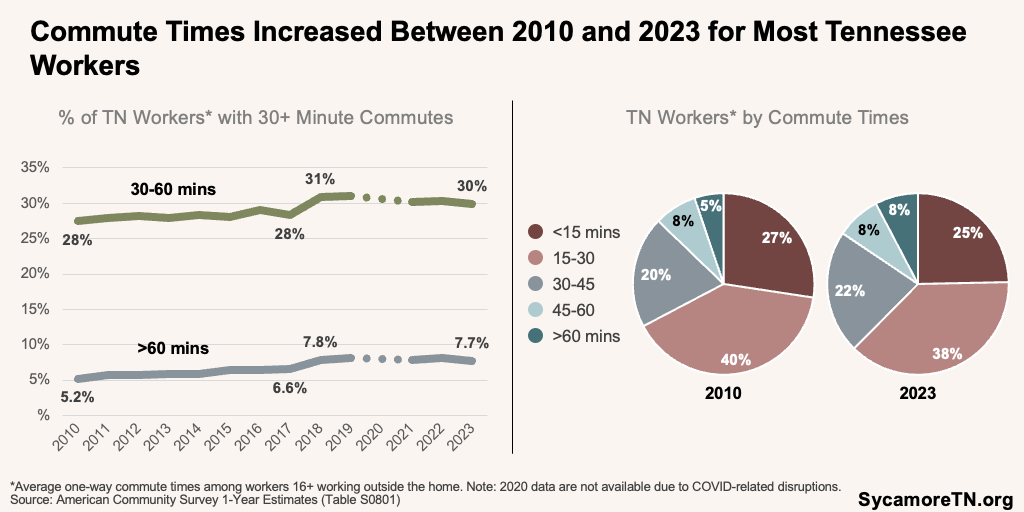
Figure 12
The proximity of housing to work and other necessities closely links to traffic congestion, commute times, and the demand for mobility options. There are more drivers on Tennessee roads that ever before, and congestion in some areas is worse than others. The reasons vary—including population trends and factors like increased tourism and entertainment travel. (103) (104) (105) Among the population trends is a migration of Tennesseans out of urban job centers where housing prices tend to be higher (discussed later). To the extent that workers live further from their jobs, driving can increase in the absence of other mobility alternatives. These trends can become self-reinforcing when more traffic boosts demand for wider highways, which may temporarily reduce travel times but often create more traffic in the long run by facilitating growth further from employment centers. (106) (107)
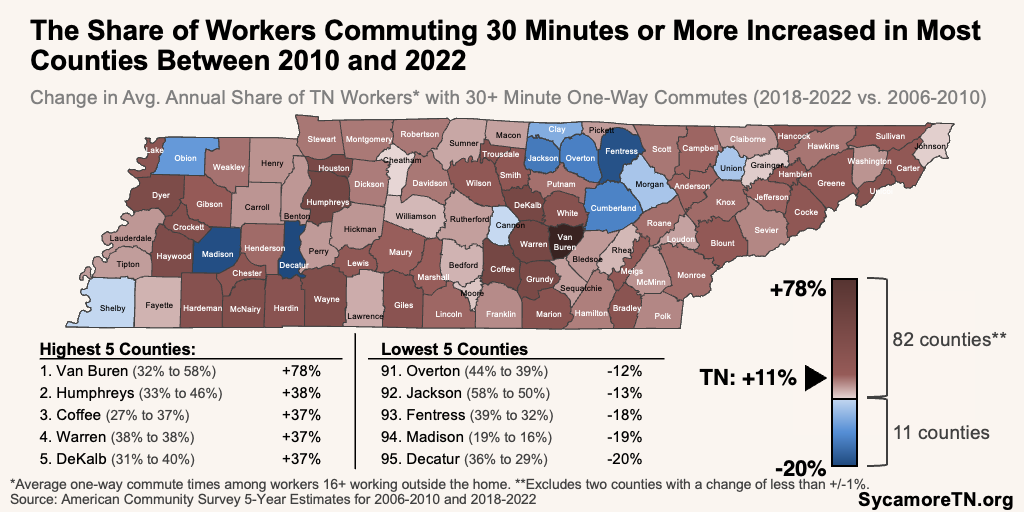
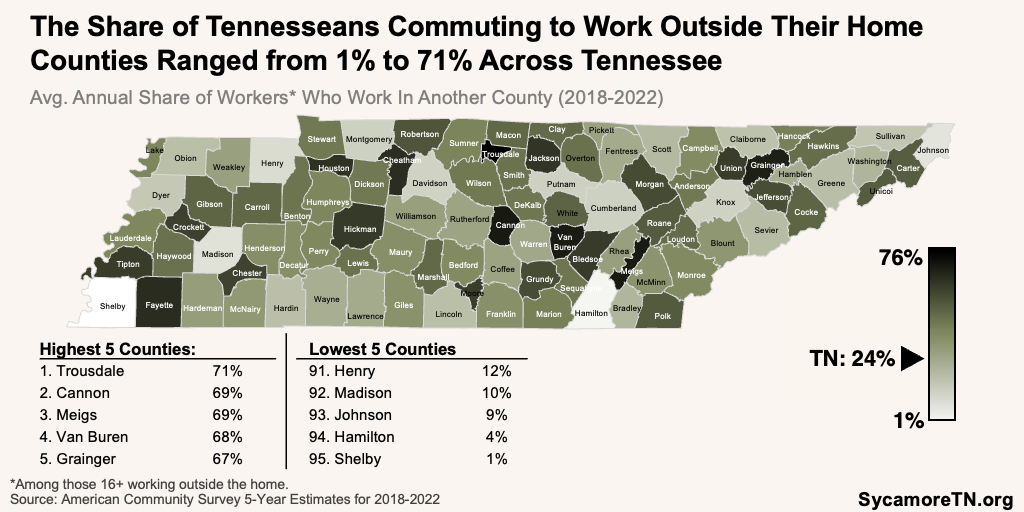
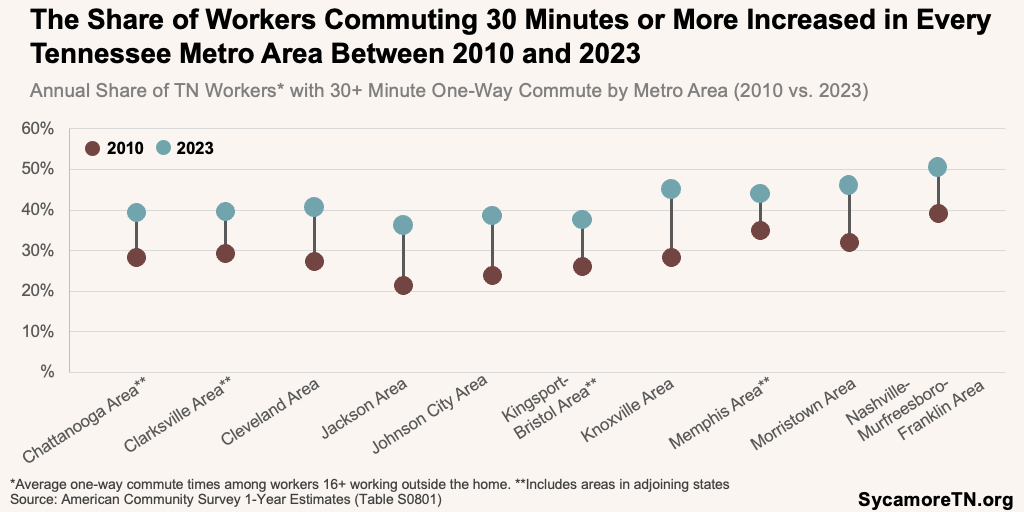
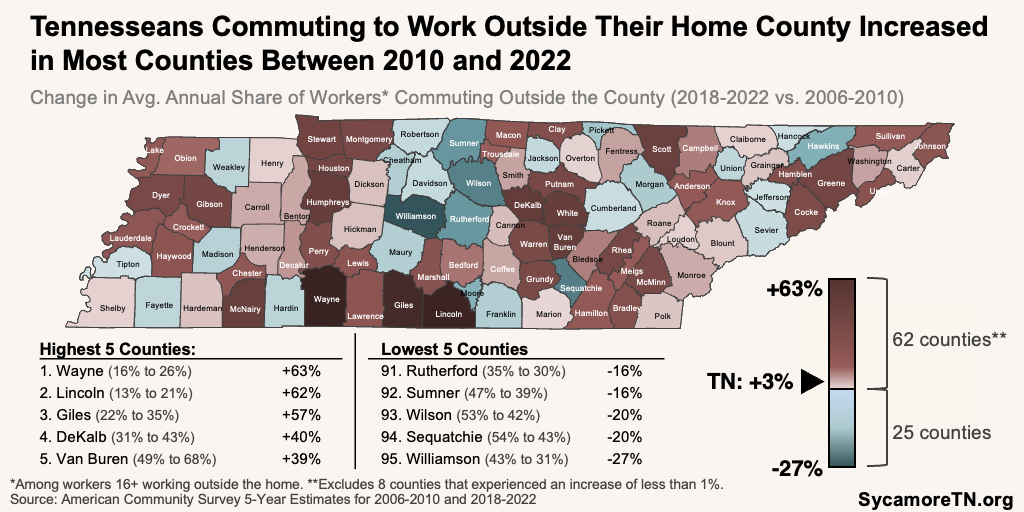
Over the last 15 years, commute times rose for most Tennesseans (Figure 11). The share with a one-way commute time of 30 minutes or more for work increased in every metro area in the state between 2010 and 2023 (Figure 12) and in all but 13 counties between the 2006-2010 and 2018-2022 periods (Figures 13 and 14). During this same time, the share of those working outside their home county increased (Figures 15 and 16). (11)
Figure 13
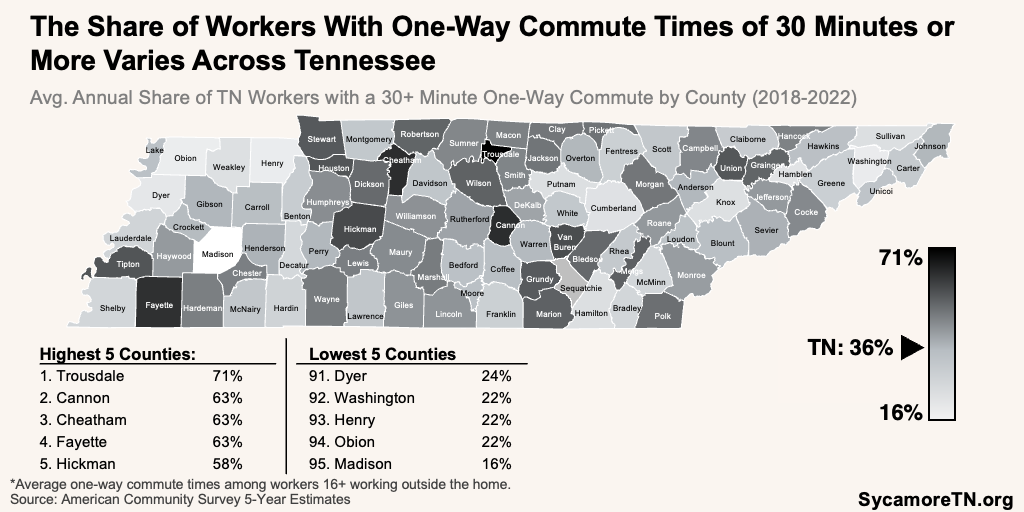
Figure 14
Figure 15
Figure 16
Education
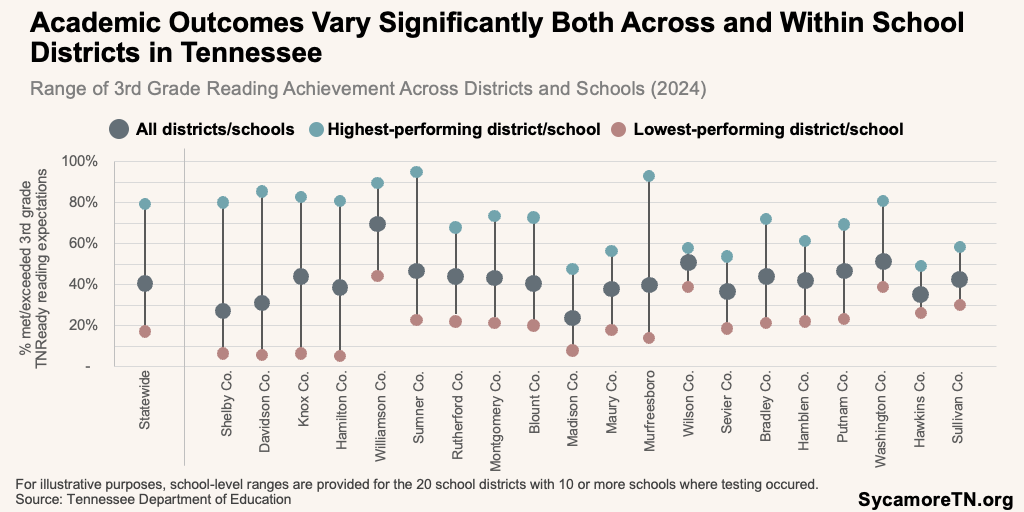
A home’s city and community often determine the educational opportunities available to a child. The location of their home determines not only a child’s school district but, in most cases, a child’s specific school—both of which can affect the quality of the educational opportunities available. For example, state assessment outcomes vary significantly both across and within Tennessee school districts (Figure 17). (108) (109) (110)
Housing, school quality, income, and educational attainment are often interconnected. Family socioeconomics, like parents’ income and educational attainment, correlate with a child’s academic success. (111) (112) (113) (114) Home prices also tend to increase as school spending and quality increase. (115) (116) (117) Because of these factors, the highest-performing schools and districts are often in areas with the highest incomes and housing costs. Indeed, school district-level data for Tennessee show that school districts’ housing costs, test scores, and parent income and education all positively correlate (Figure 18). (11) (118) (109)
Better performing, economically diverse school districts may offer opportunities for low-income students, but housing costs in these areas could shut them out. Socioeconomics, school quality, and housing costs can be self-reinforcing even as the specific causes and effects among them are disputed. However, our prior analysis showed that economically disadvantaged students in Tennessee tend to perform better in districts that are higher performing overall and more socioeconomically diverse.
Figure 17
Home prices can affect school resources, but the design of Tennessee’s school funding formula smooths out some of the difference in school districts’ revenue-raising potential. An area’s housing prices and the income of its residents affect how much revenue (i.e., property and sales tax) each local government can raise for schools and other programs and services. However, Tennessee’s education funding formula considers these factors—known as fiscal capacity—when determining how much state funding each school district receives and the minimum local contribution. However, there is no cap on how much local governments can spend on schools.
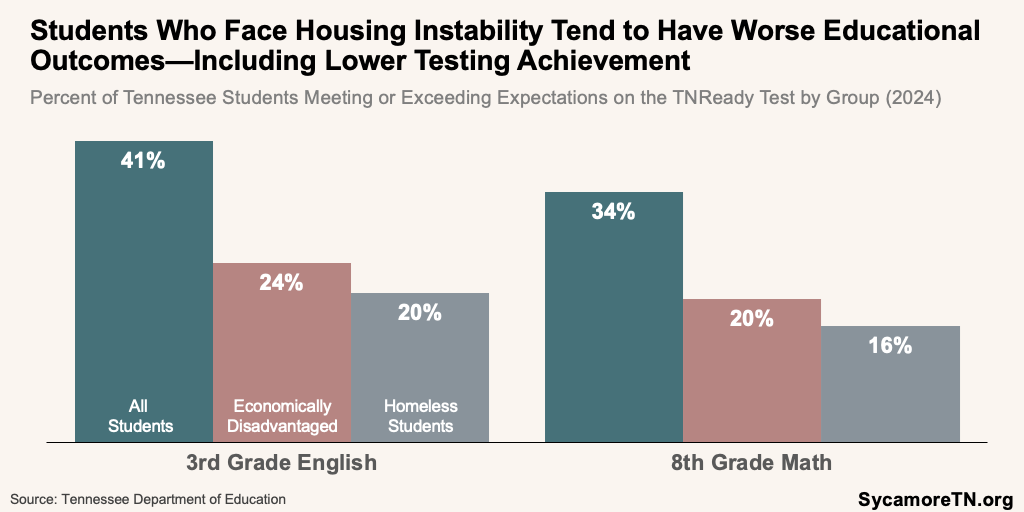
Housing instability can negatively affect a child’s educational success. Children who lack stable housing due to frequent moves, evictions, or periods of homelessness face many obstacles that result in lower academic performance. These students tend to change schools frequently and miss more days. Compared to their peers, students who experience these disruptions have shown worse outcomes on school readiness, testing performance (Figure 19), school dropout, disciplinary issues, on-time graduation, post-secondary enrollment, persistence, and completions. (119) (120) (121) (108) Children in crowded homes can also have similar outcomes due to lack of privacy, sleep disruptions, and an environment inconducive to studying. (122)
Figure 18
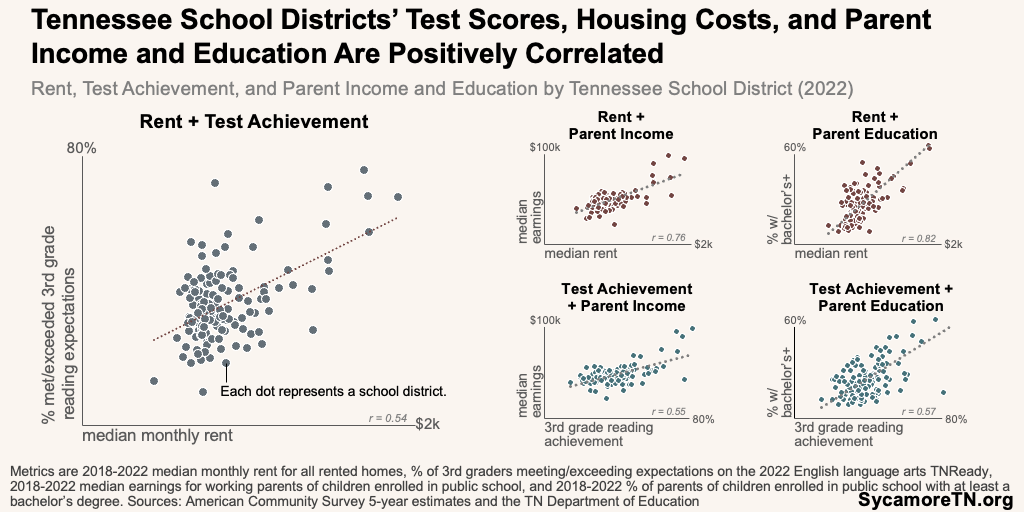
Figure 19
Regional and Spillover Effects
Housing deficiencies in one market can have consequences for an entire region. As discussed throughout this report, residents may be displaced or choose to live farther away from high-cost areas. They may then face longer commute times to work—increasing congestion on the region’s roads. An influx of new residents could also strain local resources or shift the programs and services residents want from their local governments. (123) For example, rural areas often provide fewer public services for residents than urban areas, and new residents may expect more public services in growing areas that have traditionally been more rural. (124)
Increased remote work options and worker relocations from relatively high-cost housing markets can compound housing affordability issues. (125) For example, the Nashville metro area is a beneficiary of net migration from places around the country—often from cities with higher average housing costs. Anecdotal information suggests that some new Tennessee residents also brought remote jobs from higher-paying markets. (126) (127) Together, these trends bring an influx of new residents who drive up demand for housing and bring financial resources detached from the local job market and economy.
Increasing housing prices may also contribute to a shift in generational living preferences. Young, well-educated, higher-income millennials (born between 1977 and 1996) drove renewed urban investment nationwide in the 2000s and 2010s as they sought homes close to amenities. (128) Today, millennials are increasingly looking to suburbs, which may be due to rising urban housing costs and/or a lack of options that meet family needs. Whatever the reason, this may bring changes and new preferences for suburban communities. (129)
Increased housing demand and costs can potentially contribute to the displacement of long-time residents—changing communities, culture, and access to services. Gentrification is the cascade of effects that can happen when higher-income residents move into low-cost areas. Often, these dynamics can revitalize neighborhoods—increasing the demand for housing and investments in new construction, business, and amenities. While these trends can bring improvements, new opportunities, and beneficial diversity for existing residents, they can also increase housing costs that may be unaffordable for some. For those already living in these communities, for example, increased housing costs may mean higher rent for renters or property taxes for owners. This may force long-term residents and culturally unique or racially diverse communities to disperse—moving to areas with lower housing costs. While residential diversity comes with many benefits discussed later, significant displacement can erode community culture, cohesion, social networks, and access to social services near target populations that are now more scattered. (130) (131) (132) (133)
These dynamics have played out in recent years in Middle Tennessee. For example:
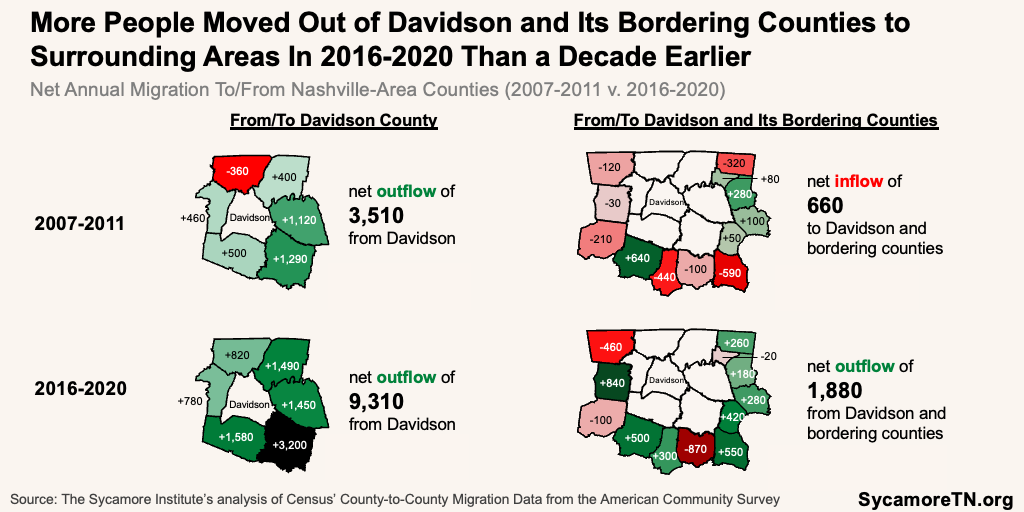
- Out-Migration — Nashville’s surrounding counties have experienced large population increases due in part to more people moving out of Davidson County (Figures 20 and 21). Six of the top 10 counties for population gains between 2007 and 2023 bordered Davidson or were one county away. Meanwhile, the latest available data show that more people were both a) moving out of Davidson and into its bordering counties and b) from Davidson or its bordering counties into the surrounding counties during 2016-2020 than in 2007-2011. (137) (138) High home prices in Nashville are often cited as a reason for the net migration out of the county. (139) (140) (141)
- Displacement — A 2023 Nashville study found that, between 2000 and 2017, the number of white residents grew in neighborhoods that traditionally had more black residents, while the number of black residents grew in surrounding areas that had traditionally been mostly white. This study attributed this shift—in part—to gentrification and the displacement of lower-income renters. (132) (133)
Figure 20
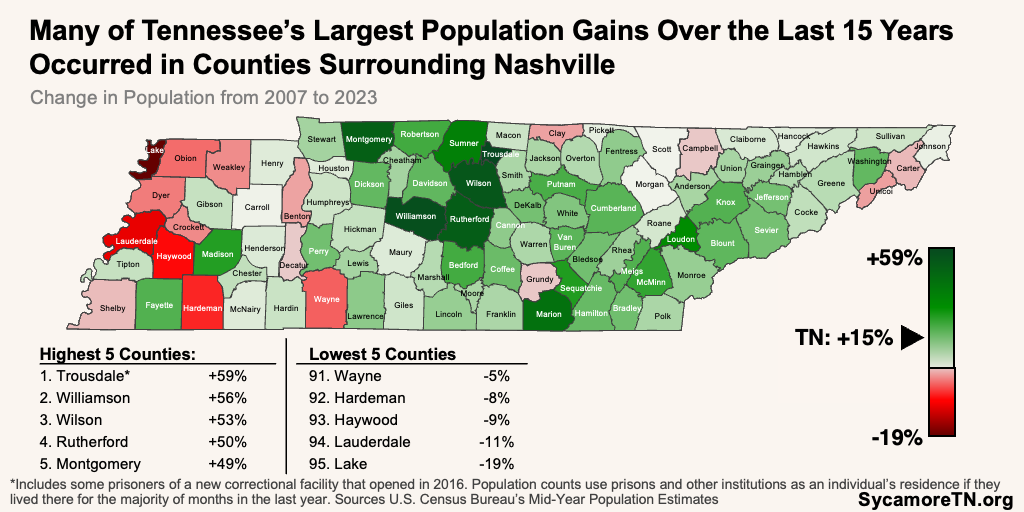
Figure 21
Local Government Finances
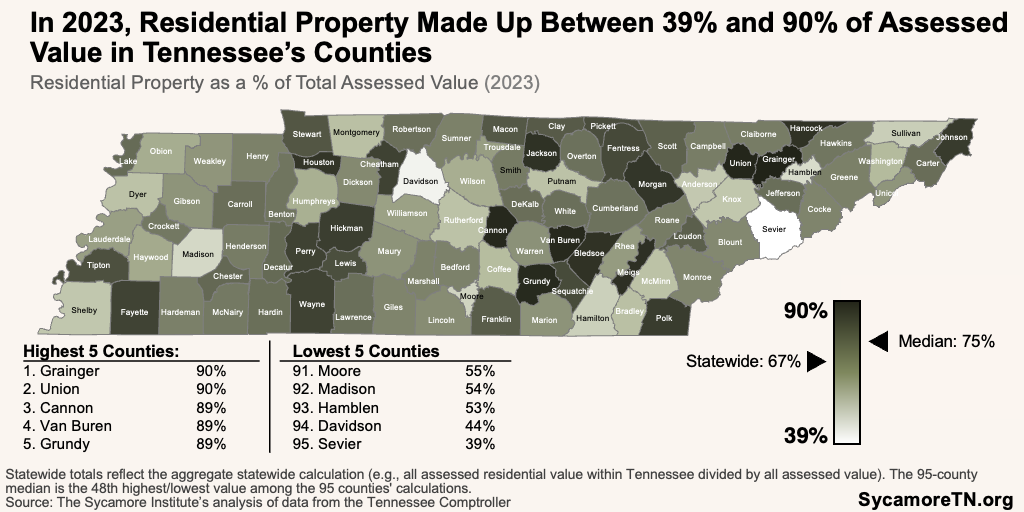
Housing has many implications for local government finances—including property taxes, the state’s largest local revenue source. In Tennessee, local property taxes are the primary source of revenue for most counties (Figure 22). (142) (143) (144) (145) (146) Residential property is the largest portion of the property tax base statewide. In 2023, residential property comprised about two-thirds of property tax assessments across the state—a proportion ranging from a high of 90% of all assessed property in Grainger and Union Counties to a low of 39% in Sevier County (Figure 23). (147)
Figure 22
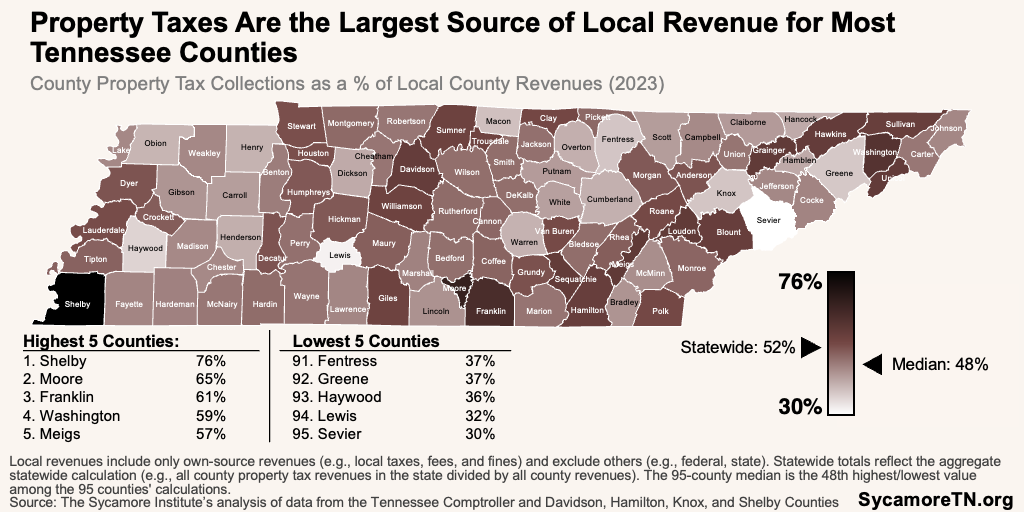
Figure 23
Increases in home values and costs do not always translate to additional tax revenues for local governments in Tennessee. Local governments may collect more revenue from increased values resulting from property improvements (e.g., a new housing development or an addition to an existing dwelling). However, under Tennessee’s “truth-in-taxation” law, local coffers do not automatically get a windfall from increased property values alone. Under the law, county property tax rates drop automatically after a reappraisal so that total county property tax collections remain unchanged. This new rate is known as the certified tax rate. If a county wants to tap into any increased appraisal values, the county commission must approve an increase to the certified property tax rate. (148) (149) Tennessee counties that saw the largest property value increases between 2008 and 2023 also had the largest decreases in property tax rates—likely because of this law.
The density of housing and development can affect the cost of local public services and infrastructure. When housing is further apart, it requires infrastructure like roadways and water systems to cover larger areas with fewer people. As a result, governments in lower-density areas tend to face higher per capita costs for roads, water, trash collection, fire and police protection, and schools. (150) (151)
Rapid housing development to meet new needs can also place fiscal pressures on existing residents. While the private sector builds houses to attract and accommodate new residents, local governments must provide other necessary infrastructure. This requires upfront capital investments in roads, utility systems, and school buildings, often before local governments collect the revenues to pay those costs. Issuing bonds can finance some of these capital projects. Even so, bonds come with debt service costs that some local governments may initially struggle to cover without increasing taxes on existing residents. (124)
Figure 24
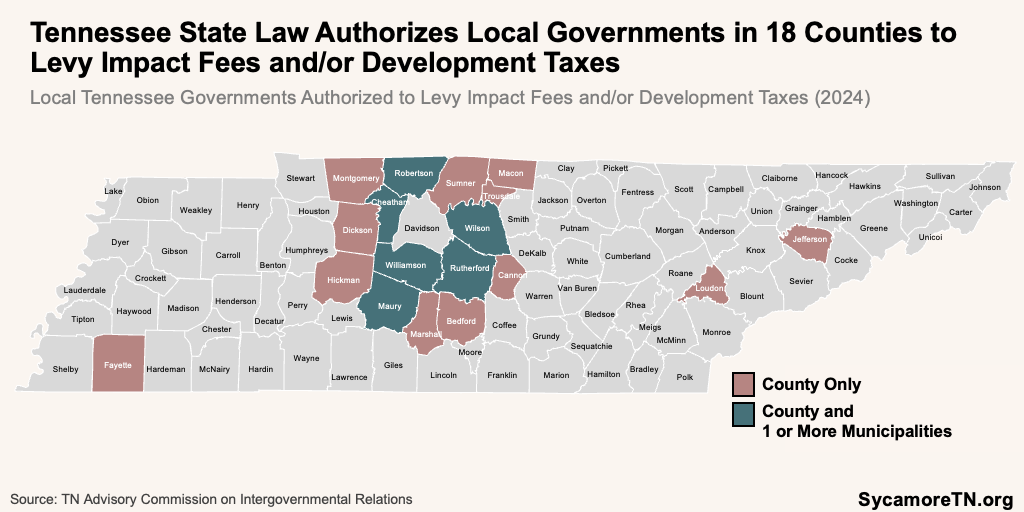
Some but not all counties in Tennessee have special fees on new construction intended to help support the infrastructure needed to accommodate rapid growth. State laws allow local governments in 18 counties to levy impact or development taxes and fees on new construction to fund infrastructure expansions (Figure 24). (100) These types of fees and taxes add to the cost of construction but—compared to other factors—are not believed to affect housing affordability substantially. (100)
Civic Life and Social Capital
Homeownership, a home’s community, and the housing options in those communities can have implications for civic life and social capital. Social capital has been described as “the glue that makes society work” and includes things like social trust, relationships and interactions with others, a sense of belonging and connectedness, and ties to the community. (152) (153) Examples of the connections between housing and social capital include:
- Neighborhood Diversity — Communities with housing that meets various needs and budgets may be more socioeconomically and demographically diverse.(154) Living, working, learning, and interacting in socioeconomically diverse communities has been connected to better health and educational outcomes and higher social capital. (155) (156) (157) (158) Conversely, one extreme version of community uniformity—concentrated poverty—can lead to neighborhoods that persistently display higher crime rates, lower economic mobility, and worse outcomes for health, education, and financial security. (159)
- Civic Spaces — Meanwhile, community resources like parks, libraries, community centers, and coffee shops offer more opportunities for social interactions and contribute to trust, happiness, and a sense of purpose and belonging.(160) (161)
- Civic Engagement — Homeownership and stable longer-term housing have also been linked to increased civic engagement like voting and volunteering.(162) (163)
Other Effects
Housing construction and characteristics also have connections to utility costs, agricultural and natural land, and the environment. For example:
- Agricultural and Natural Land Loss — The construction of new housing can contribute to a loss of agricultural and natural land—particularly when houses in new developments are more dispersed (i.e., more acreage per home).(164) (165) The loss of some types of natural lands—like wetlands that absorb and filter water for large areas—can create collateral consequences like increased flooding in other areas. (166) (167) (168) According to the University of Tennessee, at least 341,000 acres of agriculture, farm, and forest land were converted to residential uses between 2014 and 2023. (169) In recent years, residential, commercial, and road development have outpaced other causes of wetland loss in Tennessee. (170)
- Energy Efficiency — How homes are constructed and outfitted can affect energy usage and utility bills. This includes things like insulation, old appliances, drafty doors and windows, and damaged air ducts. (171)
- Natural Disaster Risks — The same natural disasters affecting health can also drive homeownership costs. Construction of homes in areas at high risk for natural disasters like flooding and wildfires often comes with high home insurance costs. One recent study found that average property insurance premiums increased by 33% nationally between 2020 and 2023 due to an increased risk of natural disasters.(172)
Housing can affect the criminal justice system when housing instability leads to incarceration. People without housing may be charged with violating laws against things like sleeping or camping on public property, trespassing, loitering, or obstruction of a passageway—which can result in fines or arrests. (173) (17) Studies have shown that formerly incarcerated individuals on probation have higher recidivism rates when they struggle to maintain stable housing. (174) Meanwhile, a criminal record can make it harder or impossible to get a home or qualify for public housing. (175)
Historical Factors
Housing policies of the past drove down property values in many low-income and minority neighborhoods. For example, mortgage and lending practices beginning in the 1930s made it difficult to invest in or move out of racially and economically segregated neighborhoods by limiting loan access. Under these practices, federal housing agencies also encouraged covenants in property deeds barring the sale of homes in white neighborhoods to black households. (176) Meanwhile, federal infrastructure efforts of the 1950s often concentrated development like interstates near or through low-income and minority neighborhoods. These policies drove down property values in these areas. (177) (77) (60) (178) (179) (180) (159) (181) (182)
Today, many of the neighborhoods targeted by these policies have features associated with less opportunity and worse outcomes. The lower property values that resulted from these policies isolated affected residents and neighborhoods and made it difficult for them to achieve physical and economic mobility for themselves and their children. The long-term effects of these and subsequent policies are disputed. However, many of the areas these policies targeted continue to have similar socioeconomic and demographic composition to the ones they did then, and their characteristics are associated with worse health and economic well-being. (177) (77) (60) (178) (179) (180) (159) (181) (182)
Parting Words
Public and private stakeholders are scrambling to address the crunch many Tennesseans feel from rising housing costs. While housing supply is an important component of making costs attainable, the characteristics of that supply have far-reaching effects on family and community success. Understanding these dynamics will be necessary for designing long-term solutions that meet the needs of all Tennesseans.
References
Click to Open/Close
References
- Tennessee Department of Safety & Homeland Security. Regular Driver License: Proof of Tennessee Residency. [Accessed on June 20, 2024.] https://www.tn.gov/safety/driver-services/classd/tnresidency.html.
- Tennessee Secretary of State. Guide on ID Requirements When Voting. 2023. [Accessed on June 20, 2024.] https://sos.tn.gov/elections/voter-id-requirements.
- Depersio, Greg. What To Bring to a Bank To Open a Checking Account. Investopedia, June 17, 2024. [Accessed on June 20, 2024.] https://www.investopedia.com/ask/answers/040715/what-should-you-bring-bank-open-checking-account.asp#:~:text=To%20open%20a%20checking%20account%2C%20you%20must%20provide%20government%2Dissued,types%20may%20require%20additional%20information.
- Tennessee Department of Human Services. Supplemental Nutrition Assistance Program (SNAP): Eligibility Information. [Accessed on June 20, 2024.] https://www.tn.gov/humanservices/for-families/supplemental-nutrition-assistance-program-snap/supplemental-nutrition-assistance-program-snap-eligibility-information.html.
- Tennessee School Boards Association. Preparation and Enrollment: Enrolling in School. 2024. [Accessed on June 20, 2024.] https://tsba.net/parent-resources/preparation-enrollment/#enrolling-in-school.
- United States Postal Service. PO Box™ – The Basics. May 14, 2024. [Accessed on July 9, 2024.] https://faq.usps.com/s/article/PO-Box-The-Basics#:~:text=Applying%20for%20a%20PO%20Box,or%20conduct%20business%20is%20verified.
- U.S. Department of Health and Human Services (HHS). Literature Summary: Housing Instability. Healthy People 2030. [Accessed on September 23, 2024.] https://health.gov/healthypeople/priority-areas/social-determinants-health/literature-summaries/housing-instability.
- Texas Department of Health and Human Services. Overview of Housing Instability. [Accessed on September 23, 2024.] https://www.txhealthsteps.com/static/courses/housing-instability/sections/section-1-2.html.
- U.S. Bureau of Labor Statistics (BLS). Table 1800. Region of Residence: Annual Expenditure Means, Shares, Standard Errors, and Relative Standard Errors. 2023 Consumer Expenditure Surveys. September 25, 2024. Accessed from https://www.bls.gov/cex/tables.htm.
- Nguyen, Joseph. 4 Key Factors That Drive the Real Estate Market. Investopedia, June 10, 2024. [Accessed on July 9, 2024.] https://www.investopedia.com/articles/mortages-real-estate/11/factors-affecting-real-estate-market.asp.
- U.S. Census Bureau. American Community Survey 1- and 5-Estimates. Last updated September 2024. Data accessed from http://data.census.gov.
- Klurfield, Kristen. Exploring the Affordable Housing Shortage’s Impact on American Workers, Jobs, and the Economy. Bipartisan Policy Center. March 2024. https://bipartisanpolicy.org/download/?file=/wp-content/uploads/2024/03/Exploring-the-Aff-Housing-Shortage-Impact-on-American-Workers-Jobs-and-the-Economy_BPC-3.2024.pdf.
- Ramakrishnan, Kriti, et al. Why Housing Matters for Upward Mobility: Evidence and Indicators for Practitioners and Policymakers. Urban Institute. January 12, 2021. https://www.urban.org/research/publication/why-housing-matters-upward-mobility-evidence-and-indicators-practitioners-and-policymakers.
- Jones, John Bailey and Neelakantan, Urvi. Portfolios Across the U.S. Wealth Distribution. Federal Reserve Bank of Richmond, Economic Brief No. 23-39. November 2023. https://www.richmondfed.org/publications/research/economic_brief/2023/eb_23-39.
- The Federal Reserve. Report on Economic Well-Being of Households in 2023: Housing. May 2024. https://www.federalreserve.gov/publications/2024-economic-well-being-of-us-households-in-2023-housing.htm.
- —. Changes in U.S. Family Finances from 2019 to 2022: Evidence from the Survey of Consumer Finances. October 2023. https://www.federalreserve.gov/publications/files/scf23.pdf.
- Galvez, Martha, et al. Housing as a Safety Net: Ensuring Housing Security for the Most Vulnerable. Urban Institute. September 2017. https://www.urban.org/sites/default/files/publication/93611/housing-as-a-safety-net_1.pdf.
- Desmond, Matthew and Gershenson, Carl. Housing and Employment Insecurity among the Working Poor. Social Problems. 2016. https://scholar.harvard.edu/files/mdesmond/files/desmondgershenson.sp2016.pdf.
- Walton, Douglas, Dastrup, Samuel and Khadduri, Jill. Employment of Families Experiencing Homelessness. Abt Associates. June 2018. https://www.acf.hhs.gov/sites/default/files/documents/opre/opre_employment_brief_06_15_2018_508.pdf.
- National Conference of State Legislatures (NCSL). Young Adult Homelessness: Options to Improve Employment and Housing Security. September 2023. https://documents.ncsl.org/wwwncsl/Human-Services/Housing-Employment%20Policy%20Snapshot.pdf.
- Anthony, Jerry. Housing Affordability and Economic Growth. Housing Policy Debate. April 7, 2022. https://doi.org/10.1080/10511482.2022.2065328.
- Urban Institute. Too Far from Jobs: Spatial Mismatch and Hourly Workers. February 21, 2019. [Accessed on July 12, 2024.] https://www.urban.org/features/too-far-jobs-spatial-mismatch-and-hourly-workers.
- Kober, Eric. The Jobs–Housing Mismatch: What It Means for U.S. Metropolitan Areas. Manhattan Institute, July 2021. [Accessed on July 12, 2024.] https://media4.manhattan-institute.org/sites/default/files/jobs–housing-mismatch-what-it-means-metropolitan-areas-EK.pdf.
- Kuhn, Sam. The US Housing Crunch’s Impact on Recruiting. Recruitonomics. April 20, 2022. https://recruitonomics.com/the-us-housing-crunchs-impact-on-recruiting/.
- Klurfield, Kristen. Exploring the Affordable Housing Shortage’s Impact on American Workers, Jobs, and the Economy. March 2024. [Accessed on July 12, 2024.] https://bipartisanpolicy.org/download/?file=/wp-content/uploads/2024/03/Exploring-the-Aff-Housing-Shortage-Impact-on-American-Workers-Jobs-and-the-Economy_BPC-3.2024.pdf.
- Saks, Raven E. Job Creation and Housing Construction: Constraints on Metropolitan Area Employment Growth. Federal Reserve Board of Governors. September 22, 2005. [Accessed on July 12, 2024.] https://www.federalreserve.gov/pubs/feds/2005/200549/200549pap.pdf.
- Chakrabarti, Ritashree and Zhang, Junfu. Unaffordable Housing and Local Employment Growth. Federal Reserve Bank of Boston. 2010. [Accessed on July 12, 2024.] https://www.bostonfed.org/publications/new-england-public-policy-center-working-paper/2010/unaffordable-housing-and-local-employment-growth.aspx.
- Shroyer, Aaron and Gaitán, Veronica. Four Reasons Why Employers Should Care about Housing. Urban Institute, Housing Matters. September 11, 2019. [Accessed on July 17, 2024.] https://housingmatters.urban.org/articles/four-reasons-why-employers-should-care-about-housing.
- Wardrip, Keith, Williams, Laura and Hague, Suzanne. The Role of Affordable Housing in Creating Jobs and Stimulating Local Economic Development: A Review of the Literature. Center for Housing Policy, January 2011. [Accessed on July 17, 2024.] https://web.archive.org/web/20160606221024/https://providencehousing.org/wp-content/uploads/2014/03/Housing-and-Economic-Development-Report-2011.pdf.
- Kneebone, Elizabeth and Holmes, Natalie. The Growing Distance Between People and Jobs in Metropolitan America. Brooking Metropolitan Policy Program. March 2015. https://www.brookings.edu/wp-content/uploads/2016/07/srvy_jobsproximity.pdf.
- Federal Reserve Bank of St. Louis. Why Is It So Difficult to Live Where You Work? The FRED Blog. July 5, 2018. https://fredblog.stlouisfed.org/2018/07/why-is-it-so-difficult-to-live-where-you-work/.
- Kober, Eric. The Jobs–Housing Mismatch: What It Means for U.S. Metropolitan Areas. Manhattan Institute. July 2021. [Accessed on July 12, 2024.] https://media4.manhattan-institute.org/sites/default/files/jobs–housing-mismatch-what-it-means-metropolitan-areas-EK.pdf.
- U.S. Bureau of Labor Statistics (BLS). May 2023 Metropolitan and Nonmetropolitan Area Occupational Employment and Wage Estimates. April 3, 2024. [Accessed on October 4, 2024.] https://www.bls.gov/oes/current/oessrcma.htm.
- Glaeser, Edward L. and Tarki, Atta. What Employers Can Do to Address High Housing Costs. Harvard Business Review. March 14, 2023. https://hbr.org/2023/03/what-employers-can-do-to-address-high-housing-costs.
- U.S. Department of Health and Human Services (HHS). Housing Instability. Social Determinants of Health Literature Summaries. [Accessed on June 5, 2024.] https://health.gov/healthypeople/priority-areas/social-determinants-health/literature-summaries/housing-instability#:~:text=Housing%20instability%20encompasses%20a%20number,of%20household%20income%20on%20housing.
- U.S. Department of Housing and Urban Development (HUD). Promoting Mental Health Through Housing Stability. PD&R Edge. May 31, 2022. https://www.huduser.gov/portal/pdredge/pdr-edge-trending-053122.html.
- Braveman, Paula, et al. Housing and Health. Robert Wood Johnson Foundation. May 1, 2011. https://www.rwjf.org/en/insights/our-research/2011/05/housing-and-health.html.
- D’Alessandro, D and Appolloni, L. Housing and Health: An Overview. Annali di Igiene: Medicina Preventiva e di Comunita. 2020. http://www.seu-roma.it/riviste/annali_igiene/open_access/articoli/Suppl1_Fascicolo5-Vol32-02-D%27Alessandro.pdf.
- Cedeño-Laurent, J.G., et al. Building Evidence for Health: Green Buildings, Current Science, and Future Challenges. Annual Review of Public Health. January 12, 2018. https://www.annualreviews.org/content/journals/10.1146/annurev-publhealth-031816-044420.
- Shaw, Mary. Housing and Public Health. Annual Review of Public Health: Vol. 25:397-418. 2004. https://www.annualreviews.org/content/journals/10.1146/annurev.publhealth.25.101802.123036.
- Andreoni, Manuela. The Heat Crisis is a Housing Crisis. June 25, 2024. https://www.nytimes.com/2024/06/25/climate/the-heat-crisis-is-a-housing-crisis.html.
- Sancar, Feyza. Childhood Lead Exposure May Affect Personality, Mental Health in Adulthood. JAMA, March 27, 2019. https://jamanetwork.com/journals/jama/fullarticle/2729713.
- Jean, Sheryl. 10 Tips to Help Make Your Home Fall-Proof and Hazard-Free. American Association of Retired Persons (AARP). December 10, 2021. [Accessed on April 18, 2023.] https://www.aarp.org/home-family/your-home/info-2021/fall-prevention-safety-tips.html.
- Pierce, Kristyn A., et al. Trajectories of Housing Insecurity From Infancy to Adolescence and Adolescent Health Outcomes. Pediatrics. July 01, 2024. https://publications.aap.org/pediatrics/article/154/2/e2023064551/197596/Trajectories-of-Housing-Insecurity-From-Infancy-to?searchresult=1.
- U.S. Department of Agriculture (USDA), Economic Research Service. Food Access Research Atlas: Data Downloads. April 27, 2021. https://www.ers.usda.gov/data-products/food-access-research-atlas/download-the-data/#Current%20Version.
- —. Food Access Research Atlas: Documentation. October 20, 2022. https://www.ers.usda.gov/data-products/food-access-research-atlas/documentation/.
- U.S. Centers for Disease Control and Prevention (CDC). National Environmental Public Health Tracking Network. [Accessed on September 25, 2024.] Data accessed from https://ephtracking.cdc.gov/DataExplorer/.
- U.S. Environmental Protection Agency (EPA). Heat Islands and Equity. August 3, 2023. [Accessed on July 11, 2024.] https://www.epa.gov/heatislands/heat-islands-and-equity#:~:text=An%20EPA%20review%20of%20several,neighborhoods%20in%20the%20same%20city.
- Metropolitan Government of Nashville and Davidson County, Tennessee. Understanding Nashville Heat. 2023. [Accessed on July 11, 2024.] https://storymaps.arcgis.com/stories/16fd1aafa83e423ba0ddf3ed110b068f#.
- Federal Emergency Management Agency (FEMA). National Risk Index: Data Resources. U.S. Department of Homeland Security. March 2023. [Accessed on September 24, 2023.] Data downloaded from https://hazards.fema.gov/nri/data-resources.
- —. National Risk Index: Technical Documentation. U.S. Department of Homeland Security. March 2023. https://www.fema.gov/sites/default/files/documents/fema_national-risk-index_technical-documentation.pdf.
- Kopko, Kimberley. The Effects of the Physical Enviornment on Children’s Development. Cornell University Department of Human Development. [Accessed on June 27, 2024.] https://cpb-us-e1.wpmucdn.com/blogs.cornell.edu/dist/7/3210/files/2020/01/Gary-Evans-Effects-of-Physical-Environment-on-Childrens-Development_final-1.pdf.
- Caporuscio, Jessica. What Are Food Deserts, And How Do They Impact Health. Medical News Today, March 8, 2024. https://www.medicalnewstoday.com/articles/what-are-food-deserts.
- Dutko, Paula, Ver Ploeg, Michele and Farrigan, Tracey. Characteristics and Influential Factors of Food Deserts. U.S. Department of Agriculture: Economic Research Service, August 2012. [Accessed on July 10, 2024.] https://www.ers.usda.gov/webdocs/publications/45014/30940_err140.pdf.
- Sanger-Katz, Margot. Giving the Poor Easy Access to Healthy Food Doesn’t Mean They’ll Buy It. The New York Times, 8 May, 2015. [Accessed on July 10, 2024.] https://www.nytimes.com/2015/05/09/upshot/giving-the-poor-easy-access-to-healthy-food-doesnt-mean-theyll-buy-it.html.
- U.S. Centers for Disease Control and Prevention (CDC). Parks, Recreation and Green Spaces. March 16, 2022. [Accessed on July 15, 2024.] https://www.cdc.gov/physicalactivity/activepeoplehealthynation/everyone-can-be-involved/parks-recreation-and-green-spaces.html.
- Sturm, Roland and Cohen, Deborah. Proximity to Urban Parks and Mental Health. The Journal of Mental Health Policy and Economics, March 2014. [Accessed on July 15, 2024.] https://www.ncbi.nlm.nih.gov/pmc/articles/PMC4049158/.
- U.S. Department of Health and Human Services (HHS). Physical Activity: Park, Trail, and Greenway Infrastructure Interventions when Implemented Alone. The Community Guide. May 29, 2024. [Accessed on July 15, 2024.] https://www.thecommunityguide.org/findings/physical-activity-park-trail-greenway-infrastructure-interventions-implemented-alone.html.
- —. Physical Activity: Park, Trail, and Greenway Infrastructure Interventions when Combined with Additional Interventions. The Community Guide. May 29, 2024. [Accessed on July 15, 2024.] https://www.thecommunityguide.org/findings/physical-activity-park-trail-greenway-infrastructure-interventions-combined-additional-interventions.html.
- —. Crime and Violence. Healthy People 2030. [Accessed on July 15, 2024.] https://health.gov/healthypeople/priority-areas/social-determinants-health/literature-summaries/crime-and-violence#:~:text=Higher%20rates%20of%20neighborhood%20safety,rated%20physical%20and%20mental%20health.&text=One%20study%20also%20found%20that,adverse.
- Meyer, Oanh L., Castro-Schilo, Laura and Aguilar-Gaxiola, Sergio. Determinants of Mental Health and Self-Rated Health: A Model of Socioeconomic Status, Neighborhood Safety, and Physical Activity. August 14, 2014. [Accessed on July 15, 2024.] https://ajph.aphapublications.org/doi/abs/10.2105/AJPH.2014.302003?journalCode=ajph.
- U.S. Centers for Disease Control and Prevention (CDC). About Adverse Childhood Experiences. May 16, 2024. https://www.cdc.gov/aces/about/index.html.
- Wolfe, Mary K., McDonald, Noreen C. and Holmes, G. Mark. Transportation Barriers to Health Care in the United States: Findings From the National Health Interview Survey, 1997–2017. American Journal of Public Health, 2020. [Accessed on July 15, 2024.] https://www.ncbi.nlm.nih.gov/pmc/articles/PMC7204444/.
- Smith, Laura Barrie, et al. More than One in Five Adults with Limited Public Transit Access Forgo Health Care Because of Transportation Barriers. Robert Wood Johnson Foundation. Urban Institute, April 2023. [Accessed on July 15, 2024.] https://www.rwjf.org/en/insights/our-research/2023/04/more-than-one-in-five-adults-with-limited-public-transit-access-forgo-healthcare-because-of-transportation-barriers.html.
- Frakt, Austin. Stuck and Stressed: The Health Costs of Traffic. The Upshot. The New York Times, January 21, 2019. [Accessed on July 15, 2024.] https://www.nytimes.com/2019/01/21/upshot/stuck-and-stressed-the-health-costs-of-traffic.html.
- County Health Rankings and Roadmaps. Long Commute – Driving Alone. 2024. [Accessed on July 15, 2024.] https://www.countyhealthrankings.org/health-data/health-factors/physical-environment/housing-and-transit/long-commute-driving-alone?year=2024&state=47&tab=1.
- Hoehner, Christine M., et al. Commuting Distance, Cardiorespiratory Fitness, and Metabolic Risk. American Journal of Preventive Medicine, June 2012. [Accessed on July 15, 2024.] https://www.ncbi.nlm.nih.gov/pmc/articles/PMC3360418/.
- Smith, Ray A. You’re Doing Your Commute Wrong. The Wall Street Journal. October 30, 2023. [Accessed on July 15, 2024.] https://www.wsj.com/lifestyle/careers/forget-the-podcast-make-your-commute-productive-30ce7955.
- Keck Medicine of USC. 5 Ways Your Commute Affects Your Health. April 29, 2024. [Accessed on July 15, 2024.] https://www.keckmedicine.org/blog/commuting-and-your-health/.
- U.S. Environmental Protection Agency (EPA). Basic Information About Lead in Drinking Water. July 23, 2024. https://www.epa.gov/ground-water-and-drinking-water/basic-information-about-lead-drinking-water#health.
- U.S. Centers for Disease Control and Prevention (CDC). Lead Exposure Symptoms and Complications. April 10, 2024. https://www.cdc.gov/lead-prevention/symptoms-complications/index.html.
- U.S. Environmental Protection Agency (EPA). EPA’s 7th Drinking Water Infrastructure Needs Survey and Assessment. May 20, 2024. https://www.epa.gov/dwsrf/epas-7th-drinking-water-infrastructure-needs-survey-and-assessment.
- Tennessee Department of Environment and Conservation. Lead and Copper Rule: Lead Service Line Inventory. [Accessed on September 25, 2024.] https://www.tn.gov/environment/program-areas/wr-water-resources/water-quality/drinking-water-redirect/lead-and-copper-rule.html.
- U.S. Department of Health and Human Services (HHS). Neighborhood and Built Environment. Healthy People 20230. [Accessed on July 15, 2024.] https://health.gov/healthypeople/objectives-and-data/browse-objectives/neighborhood-and-built-environment.
- Baumgaertner, Emily, et al. Noise Could Take Years Off Your Life. Here’s How. The New York Times, June 9, 2023. [Accessed on July 11, 2024.] https://www.nytimes.com/interactive/2023/06/09/health/noise-exposure-health-impacts.html.
- Münzel, Thomas, et al. Cardiovascular Effects of Environmental Noise Exposure. European Heart Journal, April 1, 2014. [Accessed on July 11, 2024.] https://academic.oup.com/eurheartj/article/35/13/829/634015.
- American Public Health Association. Noise as a Public Health Hazard. October 26, 2021. [Accessed on July 11, 2024.] https://apha.org/Policies-and-Advocacy/Public-Health-Policy-Statements/Policy-Database/2022/01/07/Noise-as-a-Public-Health-Hazard.
- Popovich, Nadja and Flavelle, Christopher. Summer in the City Is Hot, but Some Neighborhoods Suffer More. August 9, 2019. [Accessed on July 11, 2024.] https://www.nytimes.com/interactive/2019/08/09/climate/city-heat-islands.html.
- U.S. Centers for Disease Control and Prevention (CDC). Extreme Heat and Your Health. June 21, 2024. https://www.cdc.gov/extreme-heat/about/index.html.
- Borunda, Alejandra. Extreme Heat Makes Air Quality Worse—That’s Bad for Health. NPR, September 6, 2023. [Accessed on July 11, 2024.] https://www.npr.org/2023/09/06/1198007014/extreme-heat-makes-air-quality-worse-thats-bad-for-health#:~:text=When%20people%20breathe%20ozone%20in,waves–makes%20ozone%20pollution%20worse.
- World Health Organization (WHO). Heat and Health. May 28, 2024. [Accessed on July 11, 2024.] https://www.who.int/news-room/fact-sheets/detail/climate-change-heat-and-health.
- U.S. Centers for Disease Control and Prevention (CDC). LIHEAP and Extreme Heat – Heat & Heat-Related Illness. Environmental Public Health Tracking. [Accessed on September 24, 2024.] https://liheap-and-extreme-heat-hhs-acf.hub.arcgis.com/#ctdjwdvdl and https://www.cdc.gov/environmental-health-tracking/php/data-research/heat-heat-related-illness.html.
- U.S. Department of Commerce, National Oceanic and Atmospheric Administration, National Weather Service. Weather Related Fatality and Injury Statistics. 2 2, 2024. [Accessed on July 15, 2024.] https://www.weather.gov/media/hazstat/state22.pdf.
- Tennessee Commission on Aging And Disability. Home and Community Based Services (HCBS). [Accessed on July 10, 2024.] https://www.tn.gov/aging/our-programs/home-and-community-based-services.html.
- U.S. Centers for Medicare and Medicaid Services (CMS). What are my other long-term care choices? [Accessed on July 10, 2024.] https://www.medicare.gov/what-medicare-covers/what-part-a-covers/what-are-my-other-long-term-care-choices.
- —. Home & Community Based Services. [Accessed on July 10, 2024.] https://www.medicaid.gov/medicaid/home-community-based-services/index.html.
- —. Home- and Community-Based Services. June 9, 2023. [Accessed on ] https://www.cms.gov/training-education/partner-outreach-resources/american-indian-alaska-native/ltss-ta-center/information/ltss-models/home-and-community-based-services.
- Tennessee Department of Mental Health and Substance Abuse Services. Additional Programs and Resources. [Accessed on October 1, 2024.] https://www.tn.gov/behavioral-health/housing/additional-programs.html.
- U.S. Department of Housing and Urban Development (HUD). Permanent Supportive Housing (PSH). HUD Exchange. [Accessed on October 1, 2024.] https://www.hudexchange.info/homelessness-assistance/coc-esg-virtual-binders/coc-program-components/permanent-housing/permanent-supportive-housing/.
- Tennessee Department of Mental Health and Substance Abuse Services. TDMHSAS Supportive Housing Programs. [Accessed on October 1, 2024.] https://thda.org/pdf/Gobin-Supportive-Services-for-Housing.pdf.
- Tennessee Housing Development Agency, Tennessee Department of Economic and Community Development, and Tennessee Department of Health. FY 2024-2025 Annual Action Plan for Housing and Community Development Programs. [Accessed on October 1, 2024.] https://thda.org/pdf/24-25-Annual-Action-Plan_draft-for-public-comment.pdf.
- Yadudu, Muhammad. Transportation As a Key to Housing Affordability. Tennessee Housing Development Agency, 2018. [Accessed on July 15, 2024.] https://thda.org/pdf/Transportation-as-a-Key-Feb.pdf.
- Guo, Jing, et al. Evaluating Transit Equity And Accessibility To Affordable Housing in Tennessee. Tennessee Department of Transportation, Augst 31, 2022. [Accessed on July 16, 2024.] https://www.tn.gov/content/dam/tn/tdot/long-range-planning/research/final-reports/2019-final-reports-and-summaries/TDOT%20RES2021-08%20Final%20Report%20Approved.pdf.
- Cogan, Marin. The Impossible Paradox of Car Ownership. Vox, July 5, 2023. [Accessed on July 16, 2024.] https://www.vox.com/23753949/cars-cost-ownership-economy-repossession.
- King, David A., Smart, Michael J. and Mannville, Michael. The Poverty of the Carless: Toward Universal Auto Access. Journal of Planning Education and Research, February 1, 2019. [Accessed on July 16, 2024.] https://journals.sagepub.com/doi/abs/10.1177/0739456X18823252.
- Manville, Michael, Smart, Michael and King, David A. The Necessity of Cars. Transfers Magazine, August 2023. [Accessed on July 16, 2024.] https://transfersmagazine.org/magazine-article/issue-11/the-necessity-of-cars/#:~:text=Universal%20Auto%20Access-,Few%20inventions%20changed%20the%20American%20landscape%20more%20than%20the%20automobile,not%20become%20much%20more%20affordable.
- U.S. Department of Transportation, Bureau of Transportation Statistics. The Household Cost of Transportation: Is it Affordable? July 2, 2024. [Accessed on July 16, 2024.] https://www.bts.gov/data-spotlight/household-cost-transportation-it-affordable.
- U.S. Bureau of Labor Statistics (BLS). Table 1101. Quintiles of Income Before Taxes: Annual Expenditure Means, Shares, Standard Errors, and Relative Standard Errors. 2023 Consumer Expenditure Surveys. September 25, 2024. Downloaded from https://www.bls.gov/cex/tables.htm.
- —. Table 1721. Type of Area: Annual Expenditure Means, Shares, Standard Errors, and Relative Standard Errors. 2023 Consumer Expenditure Surveys. September 25, 2024. Downloaded from https://www.bls.gov/cex/tables.htm.
- Strickland, Michael, et al. Reducing the Burden: Increasing Housing Supply to Lower Housing Costs. Tennessee Advisory Commission on Intergovernmental Relations (TACIR). May 2024. https://www.tn.gov/content/dam/tn/tacir/2024publications/2024_HousingAffordability.pdf.
- The Center for Neighborhood Technology. Data Download: 2020 Special Release. Housing and Transportation Affordability Index. 2020. [Accessed on October 3, 2024.] https://htaindex.cnt.org/download/data.php.
- Center for Neighborhood Technology. 2020 Housing and Transportation Affordability Index Data for Tennessee Census Tracts. [Accessed on October 3, 2024.] Downloaded from https://htaindex.cnt.org/download/data.php.
- University of Tennessee Knoxville. Tennessee’s Growth is Outpacing its Infrastructure: Addressing the State’s Increasing Traffic Congestion. The Baker Center, Haslam College of Business, and Boyd Center for Business and Economic Research. February 2023. https://baker.utk.edu/wp-content/uploads/2023/03/TBLC-Transportation-Research-FINAL.pdf.
- Tennessee Department of Transportation. Traffic Count (TCDS): Traffic Volume Index and Growth Rate. [Accessed on October 25, 2024.] https://tdot.public.ms2soft.com/tcds/tsearch.asp?loc=Tdot&mod=TCDS.
- Mintzer, Adam. Traffic Analyst Explains Why Nashville Traffic is Worse Than Others, Ways to Fix It. WKRN. December 27, 2023. https://www.wkrn.com/news/local-news/nashville/traffic-analyst-explains-why-nashville-traffic-is-worse-than-others-ways-to-fix-it/.
- Blumgart, Jake. Why the Concept of Induced Demand Is a Hard Sell. Governing. February 28, 2022. https://www.governing.com/now/why-the-concept-of-induced-demand-is-a-hard-sell.
- Noland, Robert B. and Lem, Lewison L. A Review of the Evidence for Induced Travel and Changes in Transportation and Environmental Policy in the US and the UK. Transportation Research: Transport and Environment. January 2002. https://www.sciencedirect.com/science/article/abs/pii/S1361920901000098?via%3Dihub.
- Tennessee Department of Education. 2024 State-Level Assessment File. 2024. [Accessed on October 4, 2024.] Downloaded from https://www.tn.gov/education/districts/federal-programs-and-oversight/data/data-downloads.html. Data are also available from KIDS COUNT Data Center via https://datacenter.aecf.org/.
- —. 2024 District-Level Assessment File. 2024. [Accessed on October 7, 2024.] Downloaded from https://www.tn.gov/education/districts/federal-programs-and-oversight/data/data-downloads.html. Data are also available from KIDS COUNT Data Center via https://datacenter.aecf.org/.
- —. 2024 School-Level Assessment File. 2024. [Accessed on October 7, 2024.] Downloaded from https://www.tn.gov/education/districts/federal-programs-and-oversight/data/data-downloads.html.
- Sirin, Selcuk R. Socioeconomic Status and Academic Achievement: A Meta-Analytic Review of Research. Review of Educational Research. 2005. https://doi.org/10.3102/00346543075003417.
- American Psychological Association. Education and Socioeconomic Status. 2017. https://www.apa.org/pi/ses/resources/publications/education.
- Korous, Kevin M., et al. A Systematic Overview of Meta-Analyses on Socioeconomic Status, Cognitive Ability, and Achievement: The Need to Focus on Specific Pathways. Psychol Rep. 2020. https://doi.org/10.1177/0033294120984127.
- Broer, Markus, Bai, Yifan and Fonseca, Frank. A Review of the Literature on Socioeconomic Status and Educational Achievement. Socioeconomic Inequality and Educational Outcomes. May 2019. https://link.springer.com/chapter/10.1007/978-3-030-11991-1_2.
- Bayer, Patrick J., Blair, Peter Q. and Whaley, Kenneth. Public Spending on Schools Is Linked to Housing Prices. Urban Institute. April 13, 2022. https://housingmatters.urban.org/research-summary/public-spending-schools-linked-housing-prices.
- Collins, Courtney A. and Kaplan, Erin K. Demand for School Quality and Local District Administration. Economics of Education Review. June 2022. https://www.sciencedirect.com/science/article/abs/pii/S0272775722000292.
- Nguyen-Hoang, Phuong and Yinger, John. The Capitalization of School Quality Into House Values: A Review. Jounal of Housing Economics. March 2011. https://www.sciencedirect.com/science/article/abs/pii/S1051137711000027.
- U.S. Census Bureau. American Community Survey 5-Year Estimates for the National Center for Education Statistics. Education Demographics and Geographic Estimates. 2023. [Accessed on October 8, 2024.] Accessed from https://nces.ed.gov/programs/edge/TableViewer/acsProfile/2022.
- Chen, Brendan. How Housing Instability Affects Educational Outcomes. Urban Institute – Housing Matters. February 28, 2024. https://housingmatters.urban.org/articles/how-housing-instability-affects-educational-outcomes.
- Fergus, Meredith, et al. The Impact of Housing Insecurity on Educational Outcomes. Minnesota Office of Higher Education. December 2018. https://www.ohe.state.mn.us/pdf/Impact_Housing_Insecurity_&_Educational_Outcomes.pdf.
- Tennessee Department of Education. Homeless Students. [Accessed on October 4, 2024.] https://www.tn.gov/education/families/student-support/homeless-students.html.
- Habitat for Humanity International. Evidence Brief: How Does Housing Affect Children’s Education? December 2021. https://www.habitat.org/sites/default/files/documents/21-81776_RD_EvidenceBrief-6-Education_FASH-lores_1.pdf.
- Kneebone, Elizabeth. The Changing Geography of US Poverty. The Brookings Institution, February 15, 2017. [Accessed on July 18, 2024.] https://www.brookings.edu/articles/the-changing-geography-of-us-poverty/.
- Mullen, Clancy. The Costs of Growth: A Brief Overview. Duncan Associates. March 28, 2002. https://www.impactfees.com/publications%20pdf/cost_of_growth.pdf.
- Karageorge, Eleni X. Remote Work To Blame for Rise in Housing Prices. U.S. Bureau of Labor Statistics Monthly Labor Review. April 2023. https://www.bls.gov/opub/mlr/2023/beyond-bls/remote-work-to-blame-for-rise-in-housing-prices.htm#:~:text=In%20“Remote%20work%20and%20housing,than%2060%20percent%20of%20that.
- Badger, Emily, Gebeloff, Robert and Katz, Josh. The Places Most Affected by Remote Workers’ Moves Around the Country. The New York Times. June 17, 2023. https://www.nytimes.com/interactive/2023/06/17/upshot/17migration-patterns-movers.html.
- Solá, Ana Teresa. ‘Housing Affordability Is Reshaping Migration Trends,’ Economist Says. Here’s Where People Are Moving. CNBC. January 23, 2024. [Accessed on July 18, 2024.] https://www.cnbc.com/2024/01/23/10-metros-where-people-are-moving-for-affordable-housing-good-jobs.html.
- Couture, Victor and Handbury, Jessie. Urban Revival in America, 2000 to 2010. National Bureau of Economic Research Working Paper. July 2017. https://econ.uconn.edu/wp-content/uploads/sites/681/2017/08/UrbanizationPatterns_v89.pdf.
- Lee, Hyojung, Airgood-Obrycki, Whitney and Frost, Riordan. Back to the Suburbs? Millennial Residential Locations From the Great Recession to the Pandemic. Urban Studies. January 27, 2024. https://doi.org/10.1177/00420980231221048.
- U.S. Department of Housing and Urban Development (HUD). Displacement of Lower-Income Families in Urban Areas Report. May 2018. https://www.huduser.gov/portal/sites/default/files/pdf/displacementreport.pdf.
- Richardson, Jason, Mitchell, Bruce and Franco, Juan. Shifting Neighborhoods: Gentrification and Cultural Displacement in American Cities. National Community Reinvestment Coalition. 2019. https://ncrc.org/wp-content/uploads/2019/03/NCRC-Research-Gentrification-FINAL.pdf.
- Metro Nashville Human Relations Commission. How Do People Lose Their Homes? Understanding Nashville’s Housing Crisis. 2023. https://static1.squarespace.com/static/5a4fff662278e7426fdcb17c/t/5bb66e5715fcc035b8e318db/1538682459554/Understanding+Nashville%27s+AH+Crisis+-+Part+2+WEB+VERSION.pdf.
- Metro Nashville Human Relations Commission. Residential Segregation: How Did It Happen and Why Does It Persist? Understanding Nashville’s Housing Crisis. 2023. https://filetransfer.nashville.gov/portals/0/sitecontent/Human%20Realations%20Commission/docs/publications/AffordableHousingPrimerPart3.pdf.
- U.S. Census Bureau. Final 2020 Census Residence Criteria and Residence Situations. Federal Register. February 8, 2018. https://www.federalregister.gov/documents/2018/02/08/2018-02370/final-2020-census-residence-criteria-and-residence-situations?.
- U.S. Census Burea. Intercensal Estimates of the Resident Population for Counties of Tennessee: April 1, 2000 to July 1, 2010 (CO-EST00INT-01-47). Population Division. 2010. https://www2.census.gov/programs-surveys/popest/datasets/2000-2010/intercensal/county/.
- U.S. Census Bureau. Annual Estimates of the Resident Population for Counties: April 1, 2020 to July 1, 2023 (CO-EST2023-POP). Population Division. June 2024. https://www.census.gov/data/tables/time-series/demo/popest/2020s-counties-total.html.
- —. County-to-County In-, Out-, Net, and Gross Migration 2007-2011. American Community Survey. December 16, 2021. [Accessed on September 27, 2024.] https://www.census.gov/data/tables/2011/demo/geographic-mobility/county-to-county-migration-2007-2011.html.
- U.S. Census Bureay. County-to-County In-, Out-, Net, and Gross Migration 2016-2020. American Community Survey. January 17, 2023. [Accessed on September 27, 2024.] https://www.census.gov/data/tables/2020/demo/geographic-mobility/county-to-county-migration-2016-2020.html.
- DelPilar, Jackie. Thousands More People Are Moving Out of Nashville Than Moving In, Report Shows. WZTV Nashville, May 4, 2022. https://fox17.com/news/local/thousands-more-people-are-moving-out-of-nashville-than-moving-in-report-shows#.
- U.S. Department of Housing and Urban Develoopment (HUD). Comprehensive Housing Market Analysis Nashville-Davidson-Murfreesboro- Franklin, Tennessee. Office of Policy Development and Research. September 2, 2020. [Accessed on July 16, 2024.] https://www.huduser.gov/portal/publications/pdf/NashvilleTN-CHMA-20.pdf.
- Tennessee State Data Center, Boyd Center for Business and Economic Research. New Census Estimates Show Nashville-Davidson County Population Decrease in 2021. The University of Tennessee, Knoxville, March 24, 2022. [Accessed on July 16, 204.] https://tnsdc.utk.edu/2022/03/24/new-census-estimates-show-nashville-davidson-county-population-decrease-in-2021/#:~:text=New%20Census%20Estimates%20Show%20Nashville-Davidson%20County%20Population%20Decrease%20in%202021,-March%2024%2C%202022&text=Middle%2.
- Tennessee Comptroller of the Treasury. Transparency and Accountability for Governments (TAG) Exports – Revenues 2007-2023. Local Government Audit. https://comptroller.tn.gov/office-functions/la/e-services/tag-tableau/tag-exports.html.
- Shelby County Tennessee. Adopted Budget Fiscal Year 2023 Countywide All Funds Summary. https://www.shelbycountytn.gov/Archive.aspx?ADID=12212.
- The Metropolitan Government of Nashville and Davidson County. Annual Comprehensive Financial Report For The Year Ended June 30, 2023. June 2024. https://www.nashville.gov/sites/default/files/2024-06/2023_Annual_Comprehensive_Financial_Report_Final_6.25.24.pdf?ct=1719506888.
- Hamilton County Tennessee. Annual Comprehensive Financial Report For The Year Ended June 30, 2023. March 2024. https://comptroller.tn.gov/content/dam/cot/la/advanced-search/2023/other/1478-2023-CN-hamiltonco-rpt-cpa764-3-25-24.pdf.
- Knox County Tennessee. Annual Comprehensive Financial Report For The Year Ended June 30, 2023. June 2024. https://comptroller.tn.gov/content/dam/cot/la/advanced-search/2023/other/1492-2023-cn-knoxco-rpt-cpa225-1-31-24.pdf.
- Tennessee Comptroller of the Treasury. 2023 Tax Aggregate Report of Tennessee. State Board of Equalization. https://comptroller.tn.gov/content/dam/cot/pa/documents/tax-aggregate-reports/2023TaxAggregateReport.pdf.
- Tennessee Comptroller. Property Tax Reappraisal and Certified Tax Rate. State Board of Equalization. https://comptroller.tn.gov/boards/state-board-of-equalization/sboe-resources/certified-tax-rate.html.
- Green, Harry, Chervin, Stan and Lippard, Cliff. The Local Government Finance Series, Volume I: The Local Property Tax in Tennessee. Tennessee Advisory Commission on Intergovernmental Relations (TACIR). February 2002. https://www.tn.gov/content/dam/tn/tacir/documents/LOCAL_PROPERTY_TAX.pdf.
- Carruthers, John I. and Ulfarsson, Gudmundur F. Urban Sprawl and the Cost of Public Services. Environment and Planning B: Urban Analytics and City Science. 2003. https://www.ezview.wa.gov/Portals/_1995/Documents/Documents/Exhibit%20%23J1%20-%20Futurewise_UrbanSprawl.pdf.
- Mattson, Jeremy. Relationships between Density and per Capita Municipal Spending in the United States. Urban Science. September 15, 2021. https://doi.org/10.3390/urbansci5030069.
- Sawhill, Isabel V. Social Capital: Why We Need It and How We Can Create More of It. Brookings Institution. July 2020. https://www.brookings.edu/wp-content/uploads/2020/07/Sawhill_Social-Capital_Final_07.16.2020.pdf.
- Winship, Scott. Social Capital: What Is It? American Enterprise Institute. April 28, 2023. https://www.aei.org/articles/social-capital-what-is-it/.
- Hadden Loh, Tracy, Kim, Joanne and Vey, Jennifer S. Diverse Neighborhoods Are Made of Diverse Housing. Brookings. February 8., 2022. https://www.brookings.edu/articles/diverse-neighborhoods-are-made-of-diverse-housing/.
- Nai, J., et al. People in More Racially Diverse Neighborhoods are More Prosocial. Journal of Personality and Social Psychology. 2018. https://psycnet.apa.org/doi/10.1037/pspa0000103.
- Schwartz, Heather, et al. Mixed-Income Neighborhoods Expand Social Networks and Benefit Health. MacArthur Foundation. [Accessed on October 9, 2024.] https://www.macfound.org/media/files/hhm_brief_-_mixed-income_neighborhoods_expand_social_networks_benefit_health.pdf.
- Brody, Jane E. The Benefits of Talking to Strangers. The New York Times. August 3, 2020. https://www.nytimes.com/2020/08/03/well/family/the-benefits-of-talking-to-strangers.html.
- Chetty, Raj, et al. Social Capital and Economic Mobility. August 2022. https://opportunityinsights.org/wp-content/uploads/2022/07/socialcapital_nontech.pdf.
- Kneebone, Elizabeth and Holmes, Natalie. U.S. Concentrated Poverty in the Wake of the Great Recession. Brookings. March 31, 2016. https://www.brookings.edu/articles/u-s-concentrated-poverty-in-the-wake-of-the-great-recession/.
- Cox, Daniel A. and Pressler, Sam. Disconnected: The Growing Class Divide in American Civic Life. American Enterprise Institute. September 25, 2024. https://www.aei.org/research-products/report/disconnected-the-growing-class-divide-in-american-civic-life/.
- Cox, Daniel A. and Streeter, Ryan. The Importance of Place: Neighborhood Amenities as a Source of Social Connection and Trust. American Enterprise Institute. May 20, 2019. https://www.aei.org/research-products/report/the-importance-of-place-neighborhood-amenities-as-a-source-of-social-connection-and-trust/.
- Habitat for Humanity. How Does Homeownership Contribute to Social and Civic Engagement? https://www.habitat.org/sites/default/files/documents/22-85504_USRM_EvidenceBrief-CivilSocialEng_FASH-hires%20%285%29.pdf.
- Shin, Jiyon and Yang, Hee Jin. Does Residential Stability Lead to Civic Participation?: The Mediating Role of Place Attachment. Cities. July 2022. https://www.sciencedirect.com/science/article/abs/pii/S0264275122001391.
- U.S. Environmental Protection Agency (EPA). Smart Growth and Housing. 2024. https://www.epa.gov/smartgrowth/smart-growth-and-housing.
- Xie, Yanhua, et al. U.S. Farmland Under Threat of Urbanization: Future Development Scenarios to 2040. Land. February 27, 2023. https://doi.org/10.3390/land12030574.
- Gray, Matt and Ludwig, Andrea. Benefits of Isolated Wetlands in Tennessee. Univerity of Tennessee Institute of Agriculture. February 9, 2024. https://naturalresources.tennessee.edu/benefits-of-isolated-wetlands-in-tennessee.
- Tennessee Department of Environment and Conservation. What Are the Benefits of Wetlands? September 24, 2021. https://www.tn.gov/environment/program-areas/wr-water-resources/watershed-stewardship/wetlands/what-are-the-benefits-of-wetlands.html.
- Blachly, Ben. How Much Are Tennessee Wetlands Worth? University of Tennessee Baker Center for Public Policy. December 2020. https://baker.utk.edu/wp-content/uploads/2022/07/How-Much-Are-Tennessee-Wetlands-Worth.Policy.Brief_.pdf.
- University of Tennessee Center of Farm Managment. Agriculture, Farm, and Forest Land Loss. [Accessed on October 9, 2024.] https://farmmanagement.tennessee.edu/land-loss/.
- Tennessee Department of Environment and Conservation. FY 2023-2024 Surface Water Monitoring and Assessment Program Plan. Tennessee Division of Water Services. July 2023. https://www.tn.gov/content/dam/tn/environment/water/watershed-planning/wr_wq_monitoring-workplan-fy23-24.pdf.
- U.S. Department of Energy. Why Energy Efficiency Matters. https://www.energy.gov/energysaver/why-energy-efficiency-matters.
- Keys, Benjamin J. and Mulder, Philip. Property Insurance and Disaster Risk: New Evidence from Mortgage Escrow Data. National Bureau of Economic Research Working Paper #32579. June 2024. https://www.nber.org/papers/w32579.
- Shores, Kailee. How a Supreme Court Ruling on Homelessness Is Resonating with Nashville’s Unhoused Community. Nashville Banner. July 18, 2024. https://nashvillebanner.com/2024/07/18/supreme-court-ruling-tennessee-homelessness-law/#:~:text=Members%20of%20the%20unhoused%20community%20are%20often%20at%20risk%20for,record%20don’t%20pay%20well.
- Jacobs, Leah A. and Gottlieb, Aaron. The Effect of Housing Circumstances on Recidivism. Criminal Justice Behavior. September 2020. https://doi.org/10.1177%2F0093854820942285.
- Clark, Lynn. Landlord Attitudes Toward Renting to Released Offenders. Federal Probation, Volume 71 Number 1. https://www.uscourts.gov/sites/default/files/71_1_4_0.pdf.
- Federal Reserve Bank of St. Louis. Redlining. Federal Reserve History. June 2, 2023. https://www.federalreservehistory.org/essays/redlining.
- Spader, Jonathan, et al. Fostering Inclusion in American Neighborhoods. Joint Center for Housing Studies of Harvard University. https://www.jchs.harvard.edu/sites/default/files/A_Shared_Future_Chapter_1_Fostering_Inclusion_in_American_Neighborhoods.pdf.
- Casey, Joan A., et al. Race/Ethnicity, Socioeconomic Status, Residential Segregation, and Spatial Variation in Noise Exposure in the Contiguous United States. National Institute of Health: National Library of Medicine, Environmental Health Perspectives. July 25, 2017. https://www.ncbi.nlm.nih.gov/pmc/articles/PMC5744659/.
- Tabuchi, Hiroko and Popovich, Nadja. People of Color Breathe More Hazardous Air. The Sources Are Everywhere. The New York Times. April 28, 2021. https://www.nytimes.com/2021/04/28/climate/air-pollution-minorities.html.
- Tessum, Christopher W., et al. PM2.5 Polluters Disproportionately and Systemically Affect People of Color in the United States. Science Advances. April 28, 2021. https://www.science.org/doi/10.1126/sciadv.abf4491.
- Husock, Howard. The Successes and Failures of Federal Housing Policy in the 20th Century. American Enterprise Institute. April 13, 2021. https://www.aei.org/wp-content/uploads/2021/04/Husock-Testimony-4-13-21.pdf?x85095.
- Colmer, Jonathan M., et al. Income, Wealth, and Environmental Inequality in the United States. National Bureau of Economic Research Working Papers. October 2024. https://www.nber.org/papers/w33050.
Thank you to our 2024 policy intern Malini Boorgu, who contributed to this report.


