

The U.S. Census Bureau released new data in September 2025 on income, poverty, education, housing status, and health insurance coverage from 2024. (1) These metrics paint a picture of the social and economic circumstances across America. Use the dashboard below to explore the data. Key takeaways from Tennessee’s 2024 estimates are below the dashboard.

Education Levels
- An estimated 40% of Tennesseans ages 25+ had at least an associate’s degree in 2024 and 32% had a bachelor’s or more—both higher than past years and lower than national rates (Figure 1).
- Some differences in post-secondary education rates among white, black, and Hispanic Tennesseans are shrinking, but significant gaps remain (Figure 2).
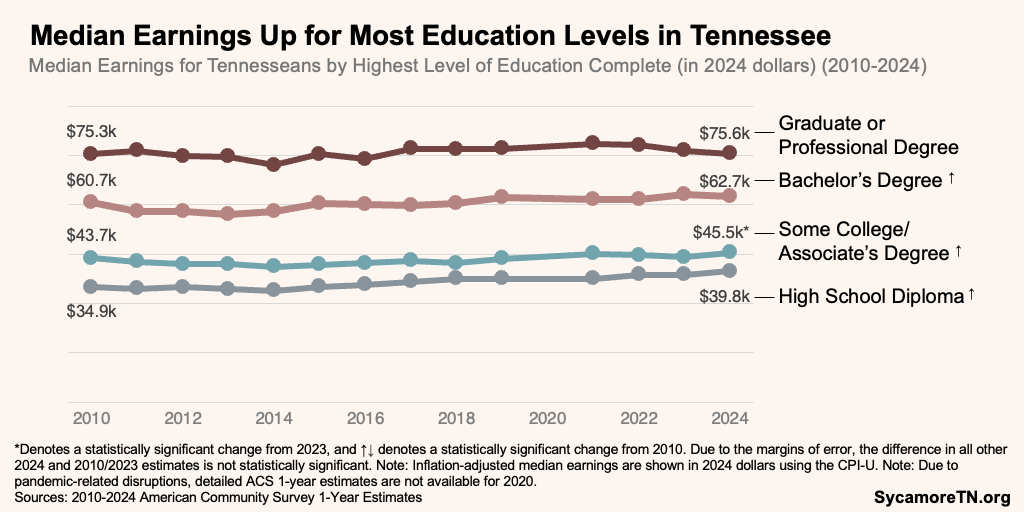
- Between 2010 and 2024, median earnings grew slightly after adjusting for inflation for Tennesseans at every educational level except those with graduate or professional degrees (Figure 3).
Figure 1
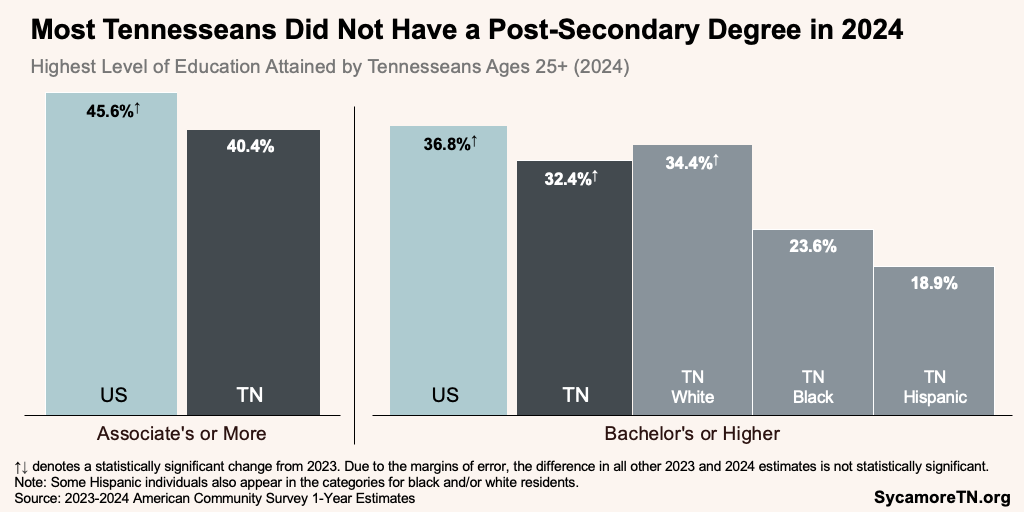
Figure 2
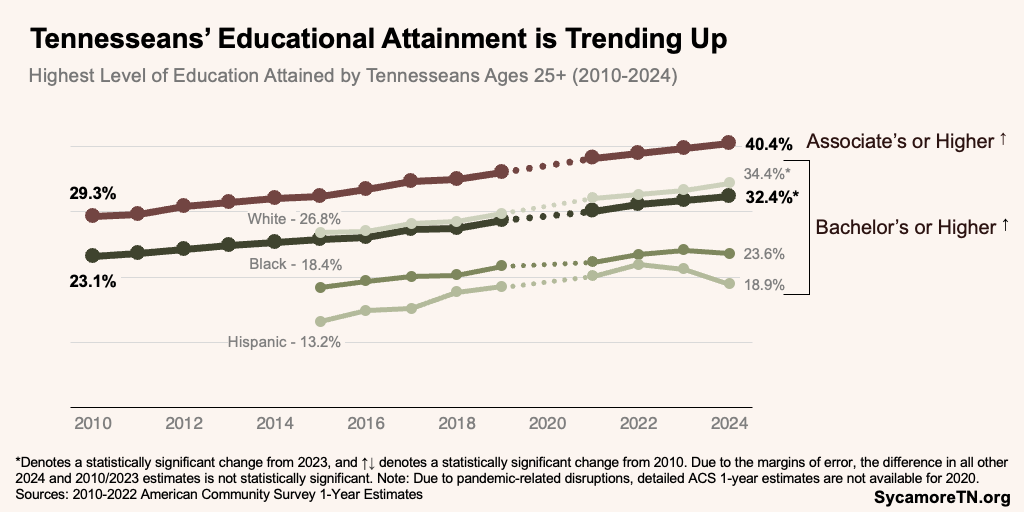
Figure 3
Income and Poverty
- After accounting for inflation, Tennesseans’ median household income grew in 2024 (Figure 4), while the proportion of Tennesseans in poverty remained unchanged (Figure 5).
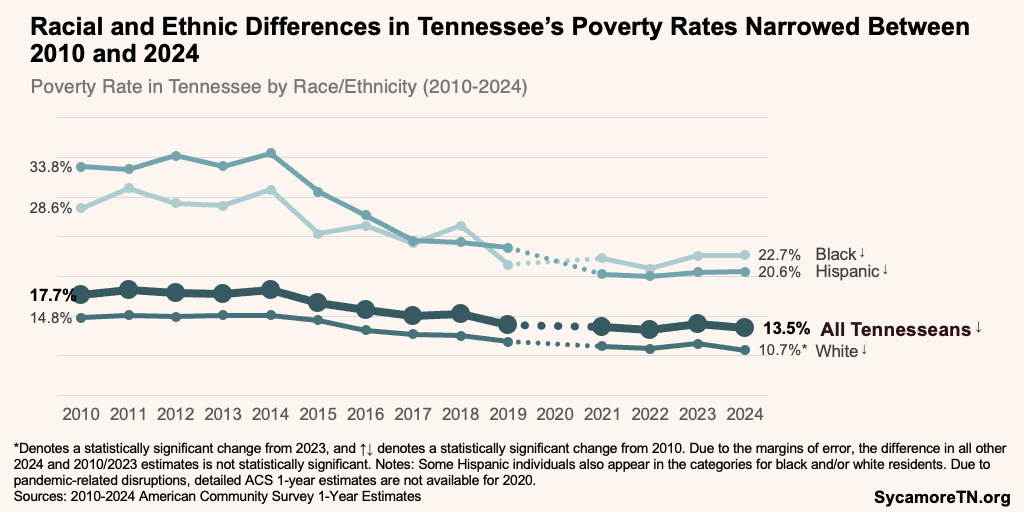
- Racial and ethnic differences in the official poverty rate shrank between 2010 and 2024 (Figure 6). Meanwhile, income gaps narrowed between white and Hispanic Tennesseans and widened for black households (Figure 4).
Figure 4
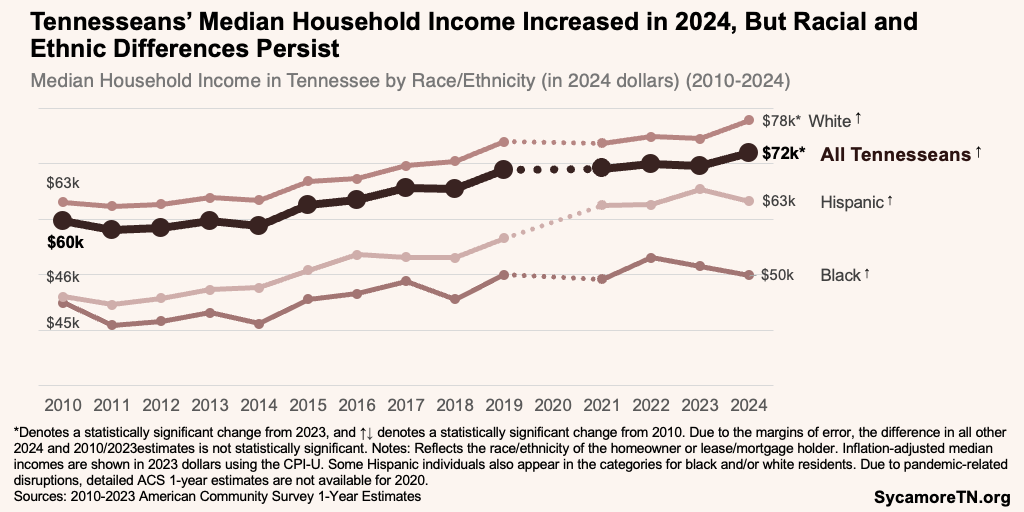
Figure 5
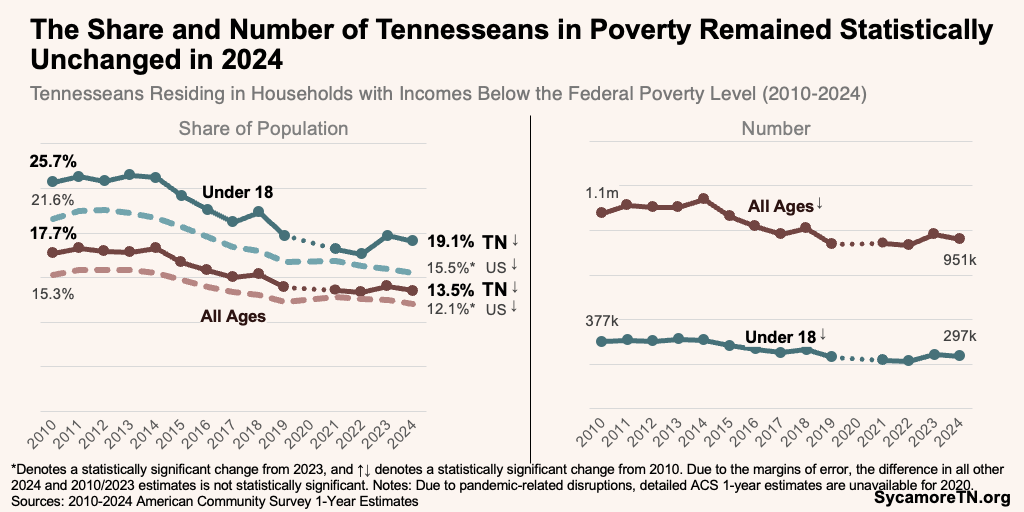
Figure 6
Health Insurance Coverage
- The number of uninsured Tennesseans increased by over 36,000 between 2023 and 2024 (Figure 7).
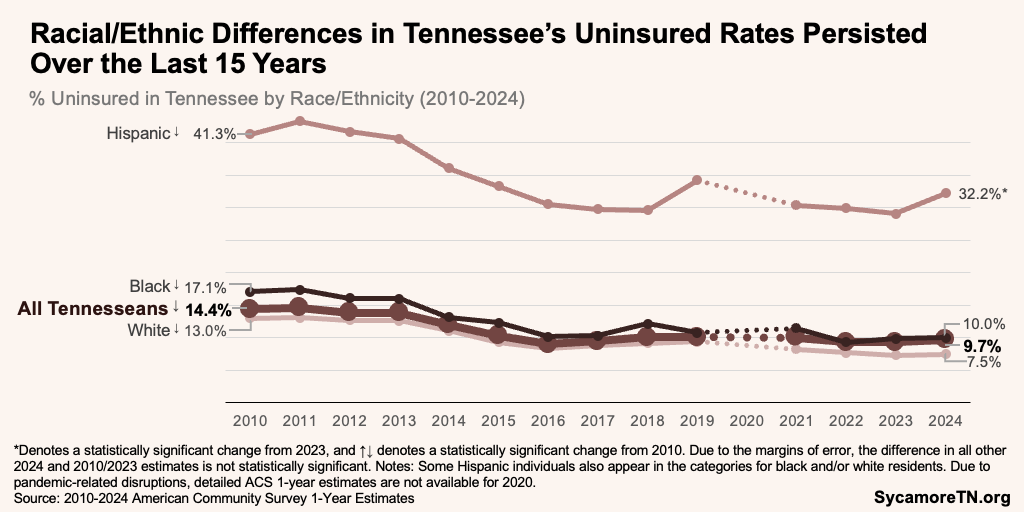
- The overall uninsured rate remained statistically unchanged, but the number of uninsured increased in a statistically significant way among children/youth and Hispanic Tennesseans (Figures 7 and 8).
Figure 7
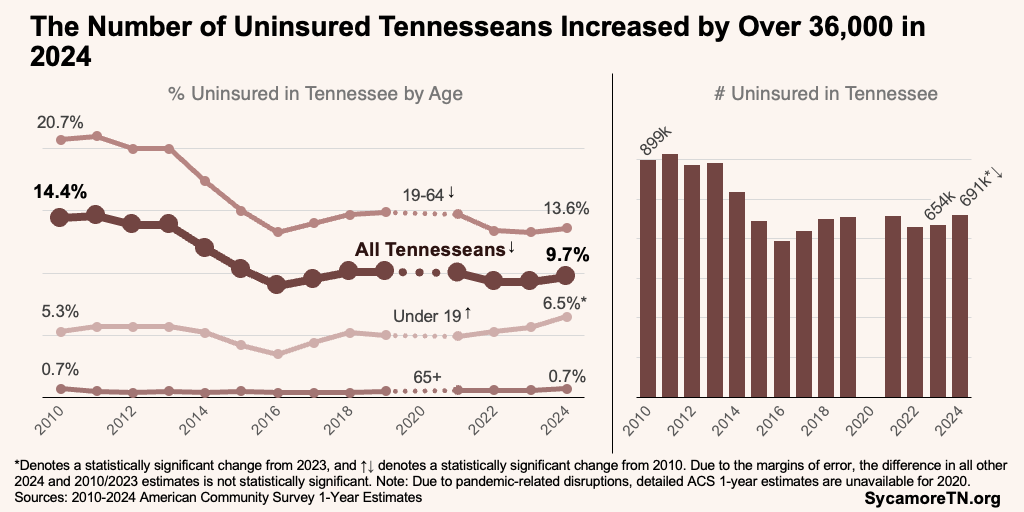
Figure 8
Housing Types and Costs
- In 2024, roughly 29% of Tennessee households were cost-burdened (i.e., spent 30% or more of their income on housing)—including 25% of mortgage holders, 10% of homeowners without a mortgage, and half of renters (Figure 9).
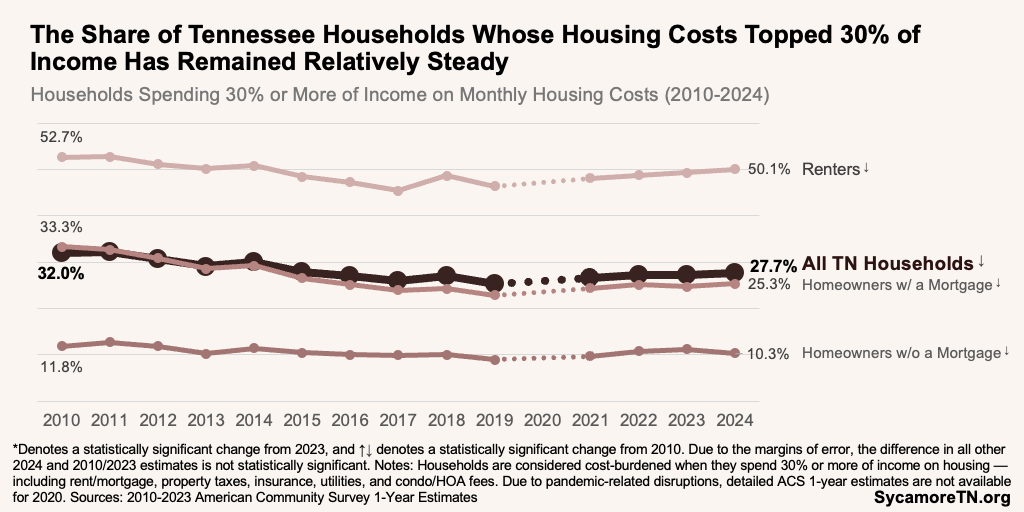
- The share of cost-burdened households has remained relatively stable in recent years (Figure 10).
Figure 9
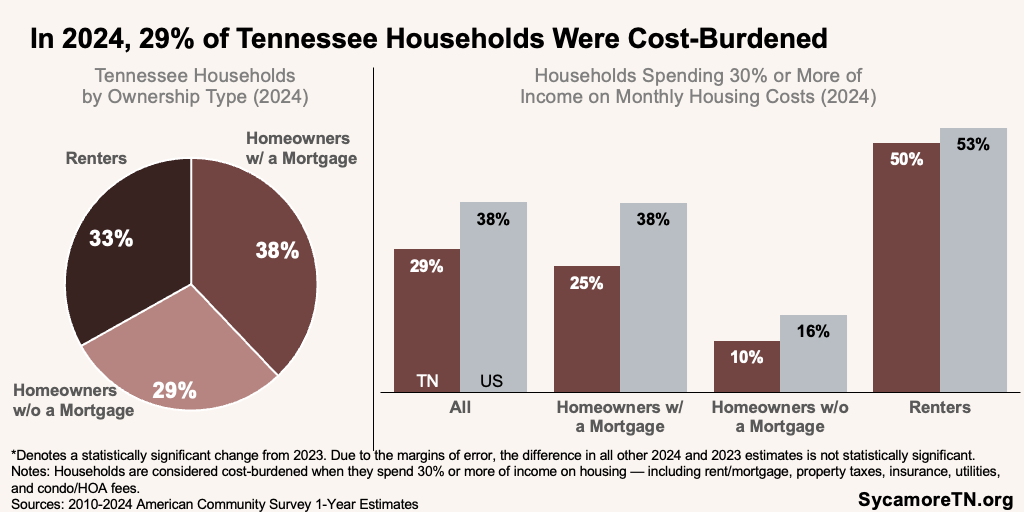
Figure 10
*This post was updated on Dec. 4, 2025 to correct an error in Figures 7 and 8.
References
Click to Open/Close
References
- U.S. Census Bureau. American Community Survey 1-Year Estimates. September 2011-2025. Accessed via https://data.census.gov/.
- U.S. Bureau of Labor Statistics. Consumer Price Index for All Urban Consumers: All Items in U.S. City Average [CPIAUCSL]. September 2025. Accessed from from FRED, Federal Reserve Bank of St. Louis at https://fred.stlouisfed.org/series/CPIAUCSL.
