

Key Takeaways
- Housing costs are not just a big city problem. They’re a statewide challenge affecting urban, suburban, and rural areas alike.
- Changes in federal funding are reshaping Tennessee’s budget outlook and creating new uncertainty for funding recipients—including state and local governments.
- Tennessee faces a major and persistent structural challenge in how to pay for road construction and maintenance.
- Clear goals for housing can help state and local decision-makers choose which of the many housing policy levers to pull.
- Households just above the poverty line will likely see the biggest drop in health insurance coverage when expanded federal subsidies expire at the end of this year.
This year, Sycamore published 13 reports and 8 interactive dashboards with state and local data while delivering 47 presentations and speaking engagements. While the two most frequent topics were housing and the shifting federal landscape, we also dove into issues like health insurance coverage. Here are the five insights from the past year that we want to make sure you didn’t miss.
1) Housing Costs Are a Statewide Challenge
Few corners of our state have escaped the problem of housing costs rising faster than household incomes. New residents from other states flocked to Tennessee in recent years, often from places with higher incomes and home prices. These demand shocks tended to hit large urban centers first but quickly rippled outward to smaller cities, suburbs, and rural communities (Figure 1).
Affordability challenges became more widespread as demand grew beyond major metros. In fact, rural areas of the state averaged a more rapidly growing gap between wages and housing costs than did urban areas. Renters and first-time homebuyers have been particularly affected by limited inventory and increased competition.
Figure 1

2) Federal Funding Shifts Are Creating New Fiscal Uncertainty
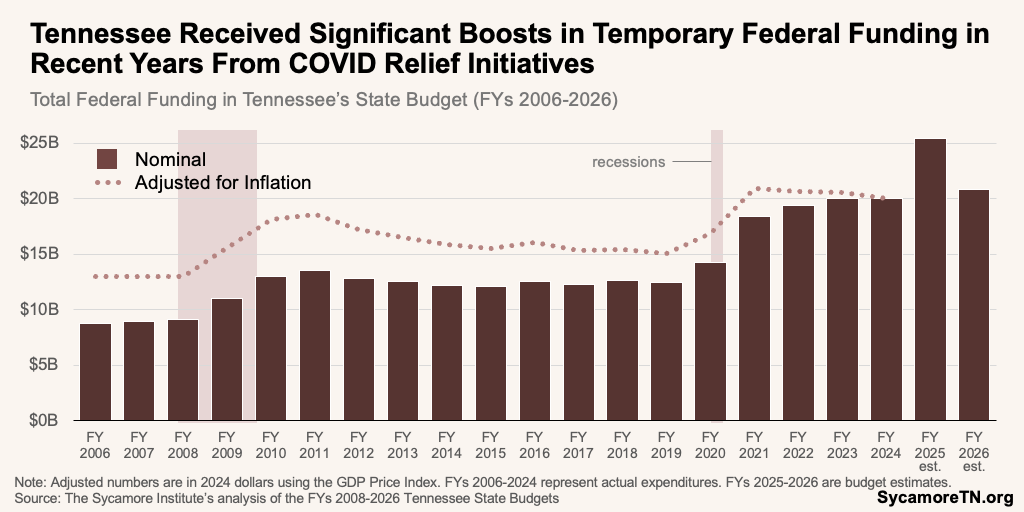
Changes in federal funding are reshaping Tennessee’s budget outlook and creating new uncertainty for funding recipients—including state and local governments. The state received significant boosts in temporary federal funding in recent years from COVID relief initiatives (Figure 2). Those funds were already set to expire, and meanwhile, federal policymakers have also made or are considering significant changes to long-standing federal programs.
Many of the most significant changes are being pursued through actions by the executive branch rather than through new laws passed by Congress, which creates additional uncertainty. Some of these actions are being challenged in court, and the outcomes could influence how much flexibility this and future administrations have to make similar decisions. Until those questions are resolved, both current policies and the longer-term direction of federal programs remain uncertain.
These shifts matter because federal funds often support ongoing services rather than one-time activities. When federal funds dry up, policymakers face choices about whether to replace those dollars with state or local revenue, reduce services, or redesign programs. Those decisions are already beginning to surface in budget planning discussions.
The timing and scale of federal funding changes underscore the importance of early planning. Understanding where federal dollars flow—and when they expire—can help policymakers avoid abrupt service disruptions and make more deliberate fiscal choices.
Figure 2
3) Tennessee Faces a Persistent Structural Challenge in How to Pay for Road Construction & Maintenance
Highway funding remains one of the clearest examples of a structural mismatch in Tennessee’s state budget. The costs of building and maintaining roads are growing faster than general inflation. Meanwhile, the primary revenue source—fuel taxes—has lagged far behind both rates of growth, leaving revenues increasingly disconnected from actual highway need (Figure 3).
A fuel tax increase and new fees on electric and hybrid vehicles enacted in 2018 and 2024 improved short-term revenues but did not resolve the underlying challenge. Because fuel taxes are not indexed for inflation, its purchasing power erodes over time. Revenues are further strained as more drivers switch to more fuel-efficient or -independent vehicles, which contribute less in Highway Fund revenues despite often being heavier and causing greater road wear. Together, these trends continue to widen the gap between funding and the true cost of maintaining Tennessee’s roads
In recent years, large transfers from the state’s general fund have been used to help fill this gap. The FY 2024 and 2026 state budgets shifted a combined $4.3 billion from the general fund to the highway fund. While these transfers provided flexibility during a period of strong revenue growth, they are not a permanent or predictable funding solution for an ongoing obligation.
These dynamics mean transportation funding pressures are likely to persist even in periods of overall budget strength. Without structural changes, highway funding will continue to compete with other priorities in the general fund and create long-term budget tradeoffs.
Figure 3

4) Clear Goals for Housing Can Help Decision-makers Choose Which of the Many Policy Levers to Pull
No single housing policy tool addresses all housing outcomes simultaneously. Some policies primarily increase supply over time, while others focus on stabilizing existing households or reducing costs for specific groups.
Confusion over goals can lead to misplaced expectations or stalled policy debates. When outcomes are unclear, policies may be criticized for failing to achieve results they were never meant to deliver.
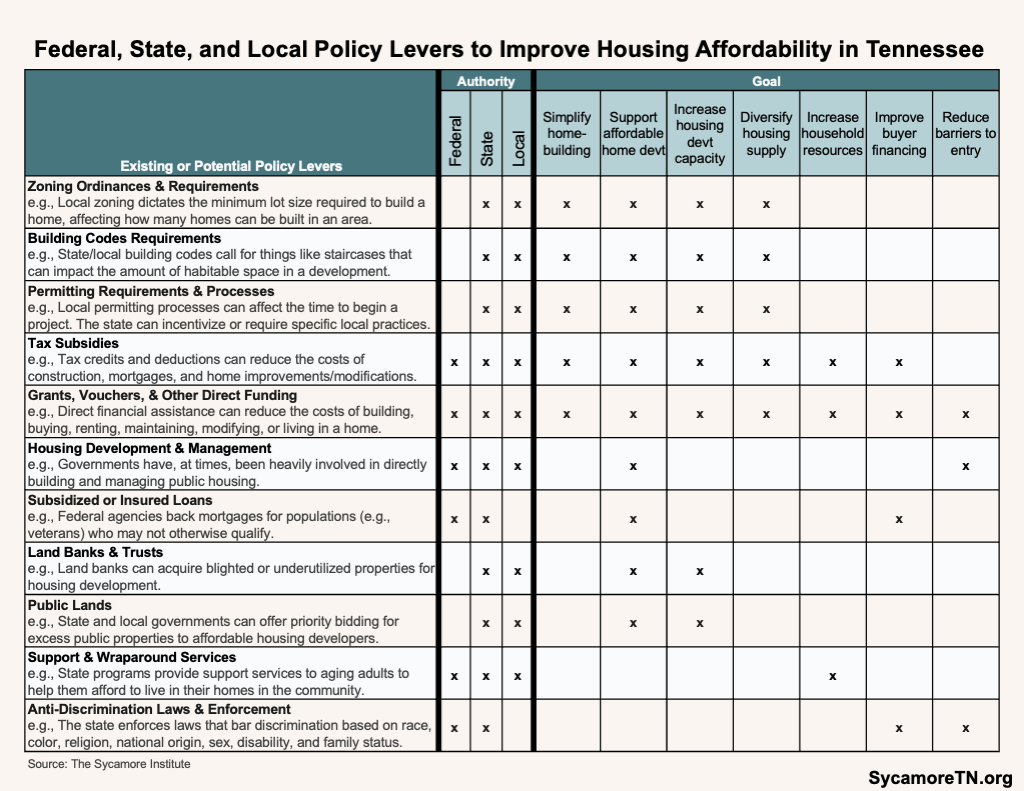
Clarifying objectives helps policymakers better match tools to desired outcomes. Table 1 illustrates how common housing policy levers align with different goals, providing a framework for more targeted and transparent decision-making.
Table 1
5) Health Insurance Coverage Losses Are Likely to Concentrate Among Near-Low-Income Adults
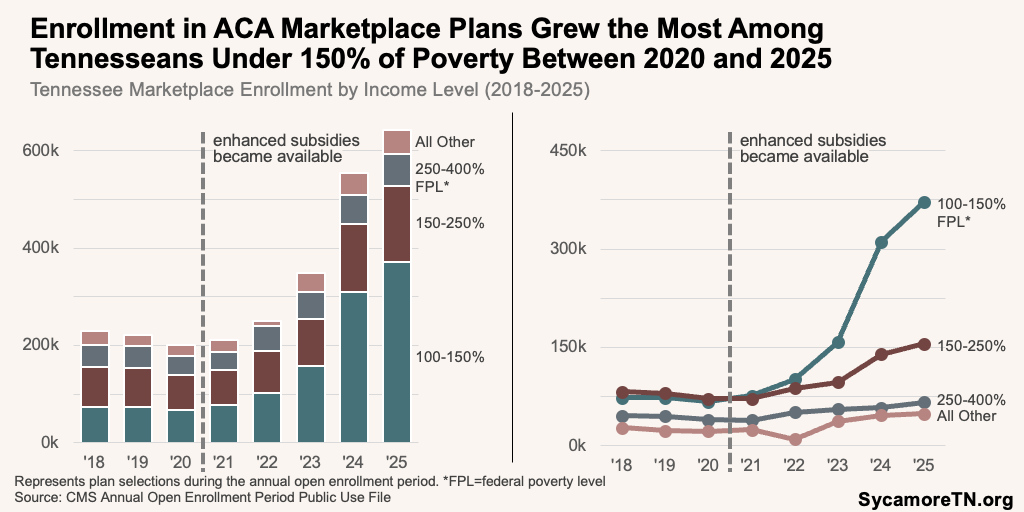
The biggest drop in health insurance coverage from the pending expiration of enhanced federal Marketplace subsidies will likely be among households just above the poverty line. Enrollment in Affordable Care Act Marketplace plans rose across all income levels after temporarily higher subsidies took effect in 2021, but the effect was highest among those with incomes between 100-150% of the federal poverty level (Figure 4). Between 2020 and 2025, enrollment in this group grew by almost 460%—from about 49,000 to over 372,000 Tennesseans.
Many people in this income range are working adults without attractive coverage alternatives. Working-age Tennesseans at this income level are typically ineligible for TennCare and often do not have access to employer-sponsored insurance. Even modest increases in premiums or out-of-pocket costs can lead to coverage loss for households with limited financial flexibility. As subsidies decline and costs increase, many will choose to forgo health insurance—with potential knock-on effects that include delayed care, additional medical debt, and higher costs to providers for uncompensated care.
Figure 4
References
Click to Open/Close
References
- Tennessee Housing Development Agency. Home Sales: New and Existing Homes. Tennessee Housing Development Agency. [Online] January 2025. https://thda.org/research-reports/tennessee-housing-market/tennessee-home-sales-data.
- U.S. Census Bureau. Small Area Income and Poverty Estimates (SAIPE). [Online] 2025. https://www.census.gov/data-tools/demo/saipe/#/?s_state=47&s_county=47001,47003,47005,47007,47009,47011,47013,47015,47017,47019,47021,47023,47025,47027,47029,47031,47033,47035,47037,47039,47041,47043,47045,47047,47049,47051,47053,47055,47057,47059,47061,4.
- State of Tennessee. Reserve balance information from the FY 2006-FY 2019 State Budgets. [Online] Available via https://www.tn.gov/finance/fa/fa-budget-information/fa-budget-archive.html.
- Tennessee General Assembly Office of Legislative Budget Analysis. “Reserves” from the 2018 Budget Summary Session Report. [Online] May 11, 2018. http://www.capitol.tn.gov/Archives/Joint/staff/budget-analysis/docs/FY%2018%2019%20Post%20Session%20Summary%205%2011.pdf.
- U.S. Bureau of Economic Analysis. Gross Domestic Product: Chain-type Price Index [GDPCTPI]. Retrieved from FRED, Federal Reserve Bank of St. Louis. [Online] February 2025. https://fred.stlouisfed.org/series/GDPCTPI.
- State of Tennessee. Tennessee State Budgets for FYs 2001-2002 through 2024-2025. [Online] 2001-2024. Available from https://www.tn.gov/finance/fa/fa-budget-information/fa-budget-archive.html.
- —. Tennessee State Budget for FY 2025-2026. [Online] February 10, 2025. https://www.tn.gov/content/dam/tn/finance/budget/documents/2026BudgetDocumentVol1.pdf. https://www.cms.gov/Research-Statistics-Data-and-Systems/Statistics-Trends-and-Reports/Marketplace-Products/Plan_Selection_ZIP.html.
- U.S. Department of Transportation. The National Highway Construction Cost Index (NHCCI). [Online] December 31, 2024. https://data.transportation.gov/Research-and-Statistics/NHCCI/r94d-n4f9/about_data.
- Centers for Medicare and Medicaid Services (CMS). 2018 OEP State-Level Public Use File. [Online] [Cited: October 16, 2025.] Downloaded from https://www.cms.gov/data-research/statistics-trends-and-reports/marketplace-products/2018-marketplace-open-enrollment-period-public-use-files.
- —. 2019 OEP State-Level Public Use File. [Online] [Cited: October 16, 2025.] Downloaded from https://www.cms.gov/data-research/statistics-trends-and-reports/marketplace-products/2019-marketplace-open-enrollment-period-public-use-files.
- —. 2020 OEP State-Level Public Use File. [Online] [Cited: October 16, 2025.] Downloaded from https://www.cms.gov/data-research/statistics-trends-and-reports/marketplace-products/2020-marketplace-open-enrollment-period-public-use-files.
- —. 2021 OEP State-Level Public Use File. [Online] [Cited: October 16, 2025.] Downloaded from https://www.cms.gov/data-research/statistics-trends-reports/marketplace-products/2021-marketplace-open-enrollment-period-public-use-files.
- —. 2022 OEP State-Level Public Use File. [Online] [Cited: October 16, 2025.] Downloaded from https://www.cms.gov/data-research/statistics-trends-reports/marketplace-products/2022-marketplace-open-enrollment-period-public-use-files.
- —. 2023 OEP State-Level Public Use File. [Online] [Cited: October 16, 2025.] Downloaded from https://www.cms.gov/data-research/statistics-trends-reports/marketplace-products/2023-marketplace-open-enrollment-period-public-use-files.
- —. 2024 OEP State-Level Public Use File. [Online] [Cited: October 16, 2025.] Downloaded from https://www.cms.gov/data-research/statistics-trends-reports/marketplace-products/2024-marketplace-open-enrollment-period-public-use-files.
- —. 2025 OEP State-Level Public Use File. [Online] [Cited: October 16, 2025.] Downloaded from https://www.cms.gov/data-research/statistics-trends-reports/marketplace-products/2025-marketplace-open-enrollment-period-public-use-files.
