

Key Takeaways
- Most Tennesseans get coverage through an employer.
- TennCare covers about 1.4 million people—but eligibility is relatively limited for working-age adults.
- The ACA Marketplace became a much larger source of coverage in Tennessee in recent years but is on the decline.
- Tennessee’s uninsured rate has fallen over the long term, but the latest data available do not capture recent trends.
- Coverage changes have implications beyond the people who gain or lose insurance.
The decisions made by Tennessee’s next governor and General Assembly will shape the state’s future for years to come. Throughout the remainder of 2026, the Sycamore Institute will release a series of concise, evidence-based insights drawn from our past research to provide context on the policies, trends, and challenges that could define Tennessee’s next chapter. Each brief offers an accessible overview of an important issue and, in some cases, links to deeper analysis for those who want to explore it further.
This brief focuses on 6 key facts about health insurance coverage in Tennessee.
1. Most Tennesseans Get Coverage Through an Employer.
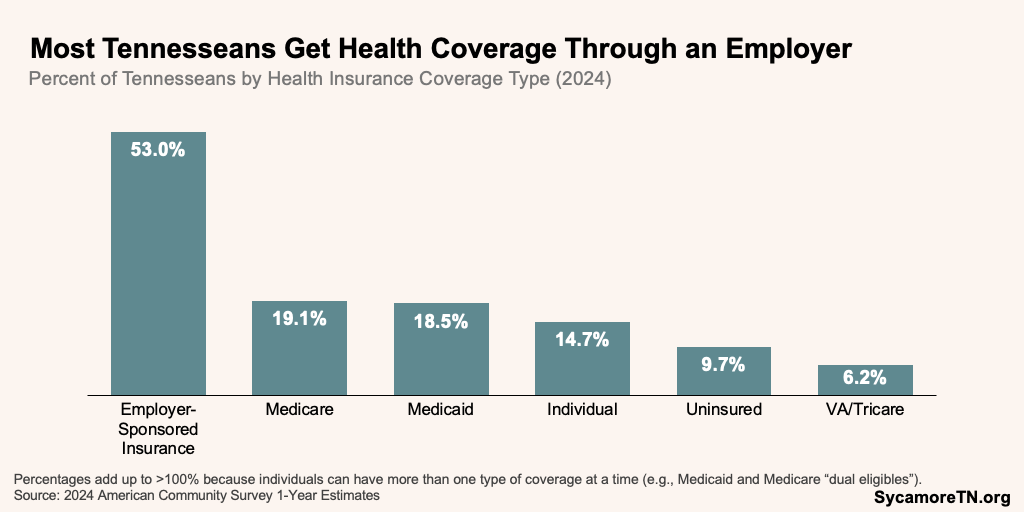
As of 2024, over 90% of Tennesseans had health insurance, and the majority of those individuals had private coverage through an employer (Figure 1).[1] The next largest coverage groups were Medicare and TennCare (the state’s Medicaid program), where about 19.1% and 18.5%, respectively, received coverage. Medicare is a federally run program primarily for older adults and those with disabilities, while Medicaid is a joint federal-state program largely for limited-income children, mothers, and individuals with disabilities. Other sources of coverage include military or veterans programs (6.2%) and the private individual market (14.7%), which includes ACA Marketplace plans purchased from Healthcare.gov. (1) People can have more than one source of coverage at a time—for example, individuals eligible for both Medicare and Medicaid (i.e., “dual-eligibles”) or Medicare enrollees who also purchase a private supplemental policy (i.e., a “Medigap” plan).
Figure 1
2. TennCare Covers About 1.4 Million People—But Eligibility is Relatively Limited for Working-Age Adults.
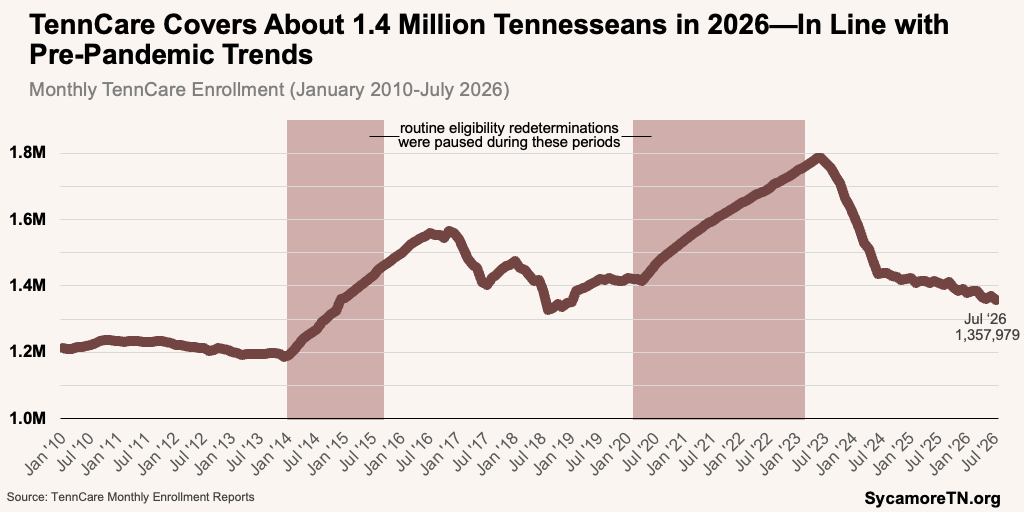
TennCare—Tennessee’s Medicaid program—provides health coverage to just under 1.4 million Tennesseans (Figure 2). Enrollment has declined from a pandemic-era peak of nearly 1.8 million in 2023 and appears to be stabilizing closer to levels seen before the pandemic. Federal pandemic policies required states to pause routine eligibility reviews between early 2020 and March 2023. When those resumed, enrollment fell sharply as TennCare reassessed whether enrollees remained eligible. By July 2026, enrollment had fallen to about 1.36 million—below the roughly 1.4 million enrolled immediately before the pandemic but in line with enrollment trends during much of the preceding decade. (2)
Qualification for TennCare depends on age, income, family circumstances, disability, and other factors—some of which Tennessee has expanded in recent years. Children generally qualify at higher household income levels than adults, while separate pathways cover pregnant women, people with disabilities, and people who need long-term services and supports. (3) Recent state policy changes have increased the income limit for pregnant women from 195% to 250% of the federal poverty level (FPL), extended postpartum coverage from 60 days to 12 months, and expanded eligibility for parents and caretaker relatives to 100% FPL. (4) (5) (6)
Figure 2
Even with these expansions, TennCare eligibility remains relatively limited for working-age adults without disabilities. Tennessee has not adopted the Affordable Care Act’s (ACA) Medicaid expansion, which allows states to cover nearly all adults with incomes up to 138% of the federal poverty level. Instead, working-age Tennesseans generally must fit into a specific eligibility category—such as being pregnant, a parent or caretaker of a dependent child, or having a qualifying disability—in addition to meeting the applicable financial requirements. As a result, low income alone does not generally qualify a working-age adult for TennCare, and adults without dependent children or disabilities have particularly limited pathways to coverage.
3. The ACA Marketplace Became a Much Larger Source of Coverage in Tennessee in Recent Years But Is on the Decline.
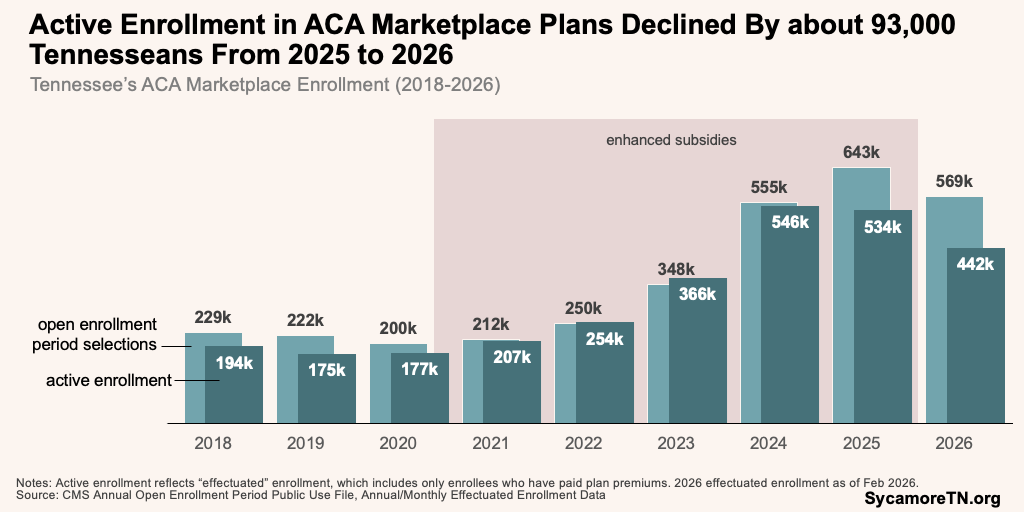
The Affordable Care Act (ACA) Marketplace became a much larger source of health coverage in Tennessee after federal subsidies were temporarily expanded in 2021. Enhanced subsidies available in 2021-2025 reduced what enrollees paid for premiums. During this time, Marketplace plan selections more than tripled—from about 200,000 Tennesseans in 2020 to nearly 643,000 in 2025 (Figure 3). Much of that growth occurred among lower-income Tennesseans with incomes between 100%-150% of FPL. (7) (8) (9) (10) (11) (12) (13) (14)
That growth has begun to reverse amid the expiration of the enhanced subsidies and other federal policy changes. Although Congress debated the topic through the end of 2025, the enhanced subsidies ultimately expired on December 31, 2025. Meanwhile, the 2025 One Big Beautiful Bill Act also tightened eligibility and enrollment requirements and eliminated subsidy eligibility for some lawfully present immigrants. (15) (16) Between 2025, and 2026, effectuated enrollment (i.e., the number of enrollees who paid their premiums) fell by about 93,000—or 17%. (17) How these changes impact health costs and the state’s uninsured rate will ultimately depend on how affected enrollees respond and the other options available to them.
Figure 3
4. Tennessee’s Uninsured Rate Has Fallen Over the Long Term, But the Latest Data Available Do Not Capture Recent Trends.
Tennessee’s uninsured rate fell substantially over the last 15 years, but recent data show some of that progress beginning to reverse (Figure 4). In 2010, 14.4% of Tennesseans lacked health insurance. By 2023, broader gains in coverage led that share to fall to 9.2%. In 2024, however, the uninsured rate increased to 9.7%—an increase of about 36,000 people, bringing the total number of uninsured Tennesseans to about 691,000. (1)
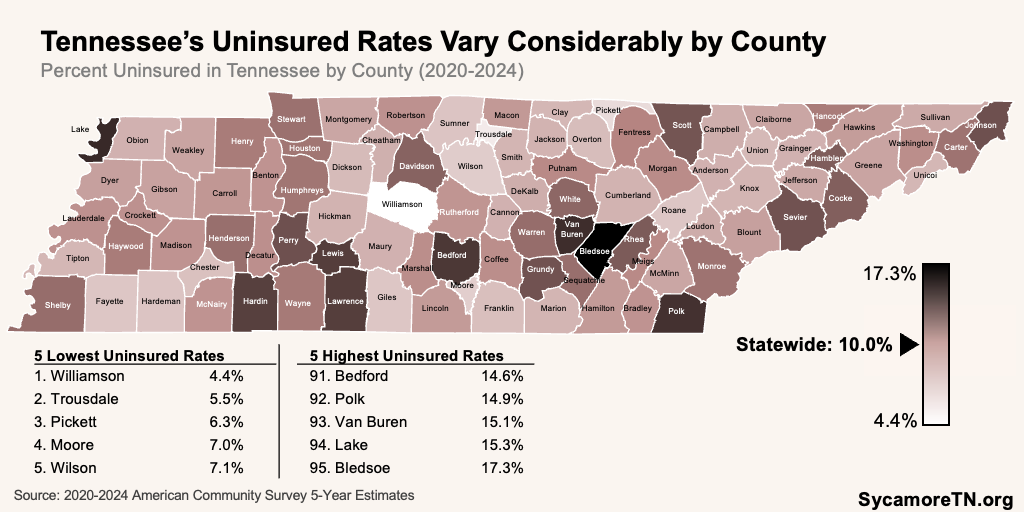
Coverage varies considerably across age, race, ethnicity, and geography. In 2024, for example, Tennessee adults ages 19-64 had the highest uninsured rate among broad age groups—with the highest rates among young adults ages 19-25 (Figure 5). Meanwhile, black, multi-racial, and Hispanic/Latino Tennesseans had considerably higher uninsured rates than white Tennesseans (Figure 5). Finally, uninsured rates across counties varied from 4.4% in Williamson County to 17.2% in Bledsoe—with rural counties having higher rates, on average (Figure 6). (1)
However, it is unclear what Tennessee’s current uninsured rate is as the latest comprehensive data do not yet capture many of the coverage changes discussed above. The most recent federal estimates cover 2024—before this year’s decline in ACA Marketplace enrollment and other recent federal policy changes that could affect coverage. Some people leaving one source of insurance may find coverage elsewhere, while others may become uninsured. As a result, we know more about how enrollment in individual programs is changing than we do about the combined effect on Tennessee’s uninsured population.
Figure 4
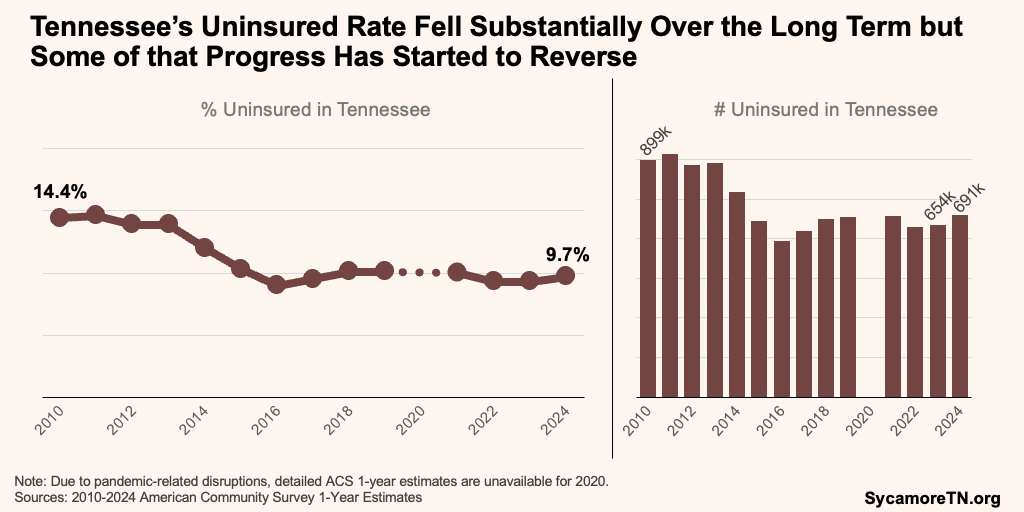
Figure 5
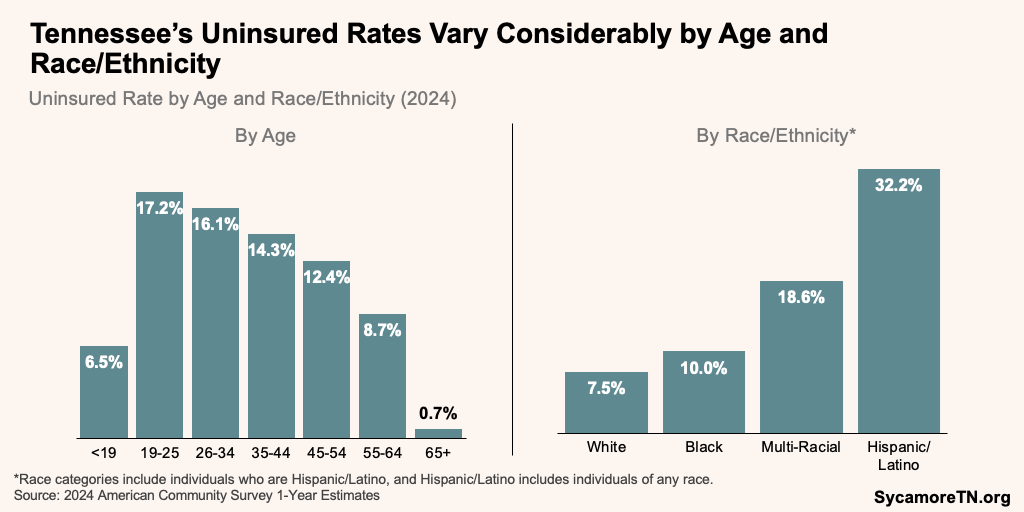
Figure 6
5. Coverage Changes Have Implications Beyond the People Who Gain or Lose Insurance.
Changes in insurance coverage can affect how and when people use health care, their financial security, and the broader health care system. For example, people without insurance are more likely to delay or forgo care because of costs and may face greater financial exposure when they do receive care. (18) (19) Coverage can also affect where people seek treatment and if and how providers are paid. As a result, increases in the uninsured population can translate into more uncompensated care for hospitals and other providers—potentially creating greater pressures for providers that serve large numbers of uninsured patients. (20) (21) (22)
Coverage changes can also have ripple effects for people who remain insured and for state policymakers. If healthier people are more likely to leave the individual insurance market as premiums rise, the remaining pool may become more costly to insure, putting additional pressure on premiums. Enrollment declines and federal funding changes could also put pressures on other areas of the state budget (e.g., increased demand for state-funded investments like the primary care and behavioral health safety nets).
Additional Sycamore Resources
- Socioeconomic Indicators Dashboards for Tennessee, Tennessee’s Counties, and Tennessee’s Legislative Districts
- Tennessee County Health Profiles
- Tennessee’s ACA Marketplace: How Enhanced Subsidies Shaped Coverage and Costs
- Medical Debt series
- A Deep Dive Into Health Insurance Coverage in Tennessee
[1] The U.S. Census Bureau typically releases prior year coverage estimates each September via the American Community Survey’s 1-year estimates. The release of 2025 estimates, however, has been delayed as the federal administration revisits the survey’s methodology.
References
Click to Open/Close
References
References
- U.S. Census Bureau. American Community Survey 1-Year and 5-Year Estimates. [Online] Accessed from https://data.census.gov/
- TennCare. Enrollment Data. [Online] Obtained from https://www.tn.gov/tenncare/information-statistics/enrollment-data.html
- —. Eligibility Reference Guide. [Online] [Cited: October 7, 2026.] https://www.tn.gov/tenncare/members-applicants/eligibility-reference-guide.html
- —. TennCare Quarterly Report (Jan-Mar 2024). [Online] April 2024. https://www.tn.gov/content/dam/tn/tenncare/archive/leg0324.pdf
- —. TennCare Increases Health Care Benefits for Pregnant and Postpartum Women. [Online] March 31, 2022. https://www.tn.gov/tenncare/news/2022/3/31/tenncare-increases-health-care-benefits-for-pregnant-and-postpartum-women.html
- —. CMS Approves TennCare III Amendment. [Online] May 21, 2024. https://www.tn.gov/tenncare/news/2024/5/21/cms-approves-tenncare-iii-amendment.html
- Centers for Medicare and Medicaid Services (CMS). 2018 OEP State-Level Public Use File. [Online] [Cited: October 16, 2025.] Downloaded from https://www.cms.gov/data-research/statistics-trends-and-reports/marketplace-products/2018-marketplace-open-enrollment-period-public-use-files
- —. 2019 OEP State-Level Public Use File. [Online] [Cited: October 16, 2025.] Downloaded from https://www.cms.gov/data-research/statistics-trends-and-reports/marketplace-products/2019-marketplace-open-enrollment-period-public-use-files
- —. 2020 OEP State-Level Public Use File. [Online] [Cited: October 16, 2025.] Downloaded from https://www.cms.gov/data-research/statistics-trends-and-reports/marketplace-products/2020-marketplace-open-enrollment-period-public-use-files
- —. 2021 OEP State-Level Public Use File. [Online] [Cited: October 16, 2025.] Downloaded from https://www.cms.gov/data-research/statistics-trends-reports/marketplace-products/2021-marketplace-open-enrollment-period-public-use-files
- —. 2022 OEP State-Level Public Use File. [Online] [Cited: October 16, 2025.] Downloaded from https://www.cms.gov/data-research/statistics-trends-reports/marketplace-products/2022-marketplace-open-enrollment-period-public-use-files
- —. 2023 OEP State-Level Public Use File. [Online] [Cited: October 16, 2025.] Downloaded from https://www.cms.gov/data-research/statistics-trends-reports/marketplace-products/2023-marketplace-open-enrollment-period-public-use-files
- —. 2024 OEP State-Level Public Use File. [Online] [Cited: October 16, 2025.] Downloaded from https://www.cms.gov/data-research/statistics-trends-reports/marketplace-products/2024-marketplace-open-enrollment-period-public-use-files
- —. 2025 OEP State-Level Public Use File. [Online] [Cited: October 16, 2025.] Downloaded from https://www.cms.gov/data-research/statistics-trends-reports/marketplace-products/2025-marketplace-open-enrollment-period-public-use-files
- American Medical Association (AMA). Summary: Changes to ACA Marketplace Eligibility, Enrollment, and Affordability. [Online] 2025. https://www.ama-assn.org/system/files/aca-enrollment-changes-summary.pdf.
- —. Summary: Changes to ACA Marketplace Eligibility and Access for Immigrants. [Online] 2025. https://www.ama-assn.org/system/files/aca-immigrant-impact-summary.pdf
- Centers for Medicare and Medicaid Services (CMS). Health Insurance Exchanges Monthly Effectuated Enrollment. [Online] February 2026. https://data.cms.gov/summary-statistics-on-beneficiary-enrollment/health-insurance-marketplace/health-insurance-exchanges-monthly-effectuated-enrollment/
- Hartman, Lacey and Walsh, Elliot. Unaffordable Health Care Costs: More U.S. Adults Forgo Care Due to Cost in 2024, Differences Seen by State, Insurance Coverage Type, Chronic Disease Status. State Health Access Data Assistance Center. [Online] April 7, 2026. https://www.shadac.org/news/unaffordable-health-care-costs-forgone-care-2024-differences-state-coverage-chronic-disease
- Tolbert, Jennifer, et al. Key Facts about the Uninsured Population. KFF. [Online] June 16, 2026. https://www.kff.org/uninsured/key-facts-about-the-uninsured-population/
- Coughlin, Teresa A., Samuel-Jakubos, Haley and Garfield, Rachel. Sources of Payment for Uncompensated Care for the Uninsured. Urban Institute. [Online] April 29, 2021. https://www.urban.org/research/publication/sources-payment-uncompensated-care-uninsured
- DeLeire, Thomas, Joynt, Karen and McDonald, Ruth. Impact of Insurance Expansion on Hospital Uncompensated Care Costs in 2014. U.S. Department of Health & Human Services (HHS). [Online] August 31, 2014. https://aspe.hhs.gov/reports/impact-insurance-expansion-hospital-uncompensated-care-costs-2014-0
- Karpman, Michael, Coughlin, Teresa A. and Garfield, Rachel. Declines in Uncompensated Care Costs for The Uninsured under the ACA and Implications of Recent Growth in the Uninsured Rate. KFF. [Online] April 6, 2021. https://www.kff.org/affordable-care-act/declines-in-uncompensated-care-costs-for-the-uninsured-under-the-aca-and-implications-of-recent-growth-in-the-uninsured-rate
