

Key Takeaways
- Over the last 30 years, recurring state spending has grown in inflation-adjusted dollars but declined relative to the state’s economy.
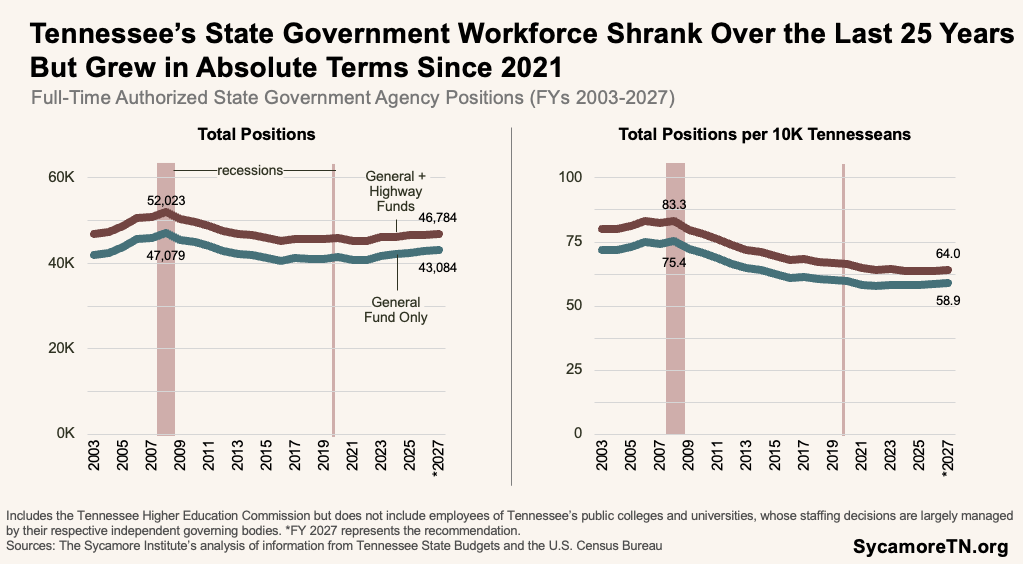
- The number of authorized state agency positions have grown since FY 2021 but fallen from its peak nearly two decades ago.
The decisions made by Tennessee’s next governor and General Assembly will shape the state’s future for years to come. Throughout the remainder of 2026, the Sycamore Institute will release a series of concise, evidence-based insights drawn from our past research to provide context on the policies, trends, and challenges that could define Tennessee’s next chapter. Each brief offers an accessible overview of an important issue and, in some cases, links to deeper analysis for those who want to explore it further.
This brief—based on excerpts from the Sycamore Institute’s Tennessee State Budget Primer—examines three decades of trends in Tennessee’s recurring spending, past budget reductions, and changes in the size of the state government workforce.
Context
Governor-elect Marsha Blackburn has identified government efficiency and spending reductions as priorities for her incoming administration. As Tennessee prepares for a new administration, how much has state government spending grown over time, and how has its workforce changed? The answers provide useful context for understanding the state’s fiscal landscape and evaluating potential changes.
State Spending and Staffing Over Time
The extent to which Tennessee’s recurring spending has grown over the last 30 years depends on how it is measured (Figure 1). Appropriations from recurring revenues totaled $20.7 billion in FY 2025—or about $2,820 per Tennessean—30-year highs even after adjusting for inflation. However, that same amount as a share of Tennessee’s GDP and total personal income was historically low. (1) (2) (3) (4)
Figure 1
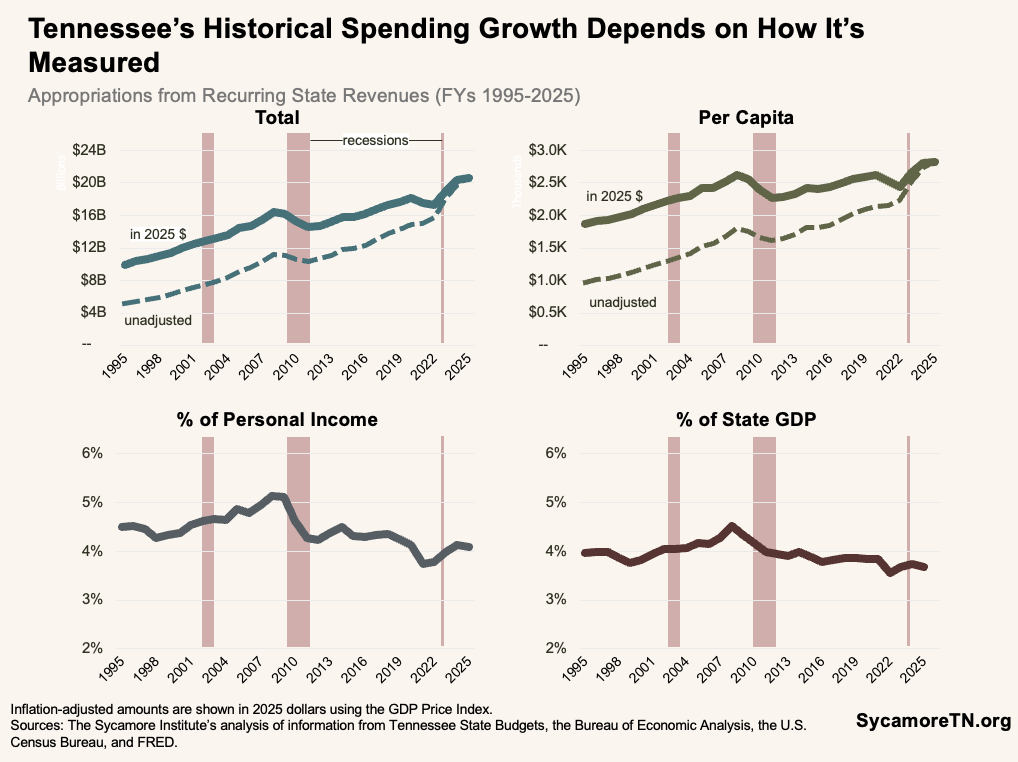
Even within this growing base, policymakers made spending and staffing cuts. For example, recurring spending totals include the net effect of both recurring increases and targeted recurring base budget reductions, which were historically large during and after the Great Recession (Figure 2). Meanwhile, Tennessee’s state government workforce grew by nearly 1,600 authorized full-time state agency positions between FYs 2021 and 2027. Over a longer 25-year window, however, the workforce shrunk in both absolute terms and relative to the state’s population (Figure 3).[1] Compared to its peak in FY 2008, the number of positions funded by the General and Highway Funds fell by more than 5,200—or about 10%—by FY 2027. (1)
Figure 2
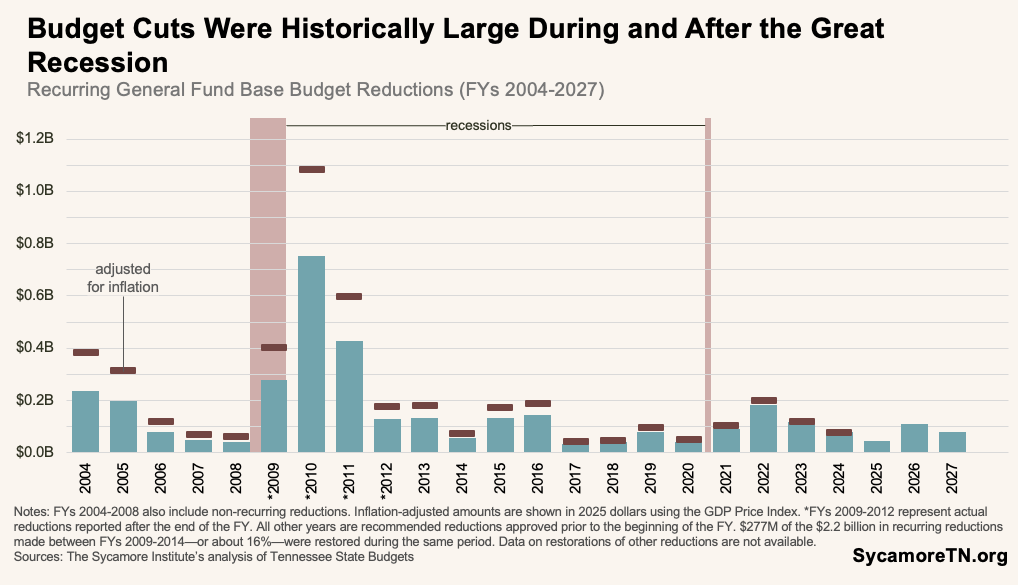
Figure 3
[1] Includes the Tennessee Higher Education Commission (THEC) but excludes the University of Tennessee system and the six locally-governed public universities, which largely maintain autonomy over staffing decisions based on the policies of each institution’s governing board.
References
Click to Open/Close
References
- State of Tennessee. Information from the FY 2002-FY 2027 State Budgets. [Online] Available via https://www.tn.gov/finance/fa/fa-budget-information/budget-archive.html.
- U.S. Bureau of Economic Analysis (BEA). Gross Domestic Product: Implicit Price Deflator [GDPDEF]. [Online] [Cited: May 19, 2026.] retrieved from FRED, Federal Reserve Bank of St. Louis at https://fred.stlouisfed.org/series/GDPDEF.
- —. SAINC1 Personal Income Summary: Personal Income, Population, Per Capita Personal Income. [Online] December 2025. Accessed from https://apps.bea.gov/itable/iTable.cfm?ReqID=70&step=1.
- U.S. Census Bureau. Annual Estimates of the Resident Population for the United States, Regions, States, District of Columbia and Puerto Rico: April 1, 2020 to July 1, 2025 (NST-EST2025-POP). [Online] January 2026. Accessed from https://www.census.gov/data/tables/time-series/demo/popest/2020s-state-total.html.
- State of Tennessee. 6-Year Recurring Base Reduction Summary – State Appropriations Fiscal Years 2008-2009 Through 2013-2014 Recommended. FY 2014 Tennessee State Budget – Volume 2: Base Budget Reductions. [Online] February 2013. https://www.tn.gov/content/dam/tn/finance/budget/documents/budget-archive/reduction-documents/2014BudgetDocumentVol2.pdf.
