Housing is an important driver of health and well-being. Housing affordability and housing quality both influence health through direct and indirect pathways.
- Affordability — When people have affordable housing, they have more resources available for other needs like medical care, food, transportation, and clothing. The financial burden of high housing costs is also a source of stress and can negatively impact mental health.
- Quality — Living in safe, quality housing decreases exposure to harmful pollutants, allergens, and toxins that lead to health problems like respiratory infections and asthma.
Below, we discuss what the research says about the connection between affordable, quality housing and health and examine the housing and health intersection in Tennessee.
Affordable Housing
Unaffordable housing is typically defined as housing expenses that are more than 30% of household income. (1) These expenses include rent or mortgage payments, property taxes, and homeowner’s or renter’s insurance. Spending a large percentage of income on housing means that individuals and families have less money for other needs such as food, health care, transportation, and clothing. The financial strain, stressors, and difficult choices that accompany unaffordable housing are associated with many adverse health outcomes. (2)
Research shows:
- As a state’s average rent increases, the food insecurity rate also increases. (3)
- Low-income households that spend more than 50% of their incomes on housing costs spend 41% less on food each month than similar households. (4)
- Adults living in unaffordable housing are more likely to describe their health as fair or poor than other adults.
- Living in unaffordbale housing is associated with higher levels of stress, depression, and anxiety. (2)
Figure 1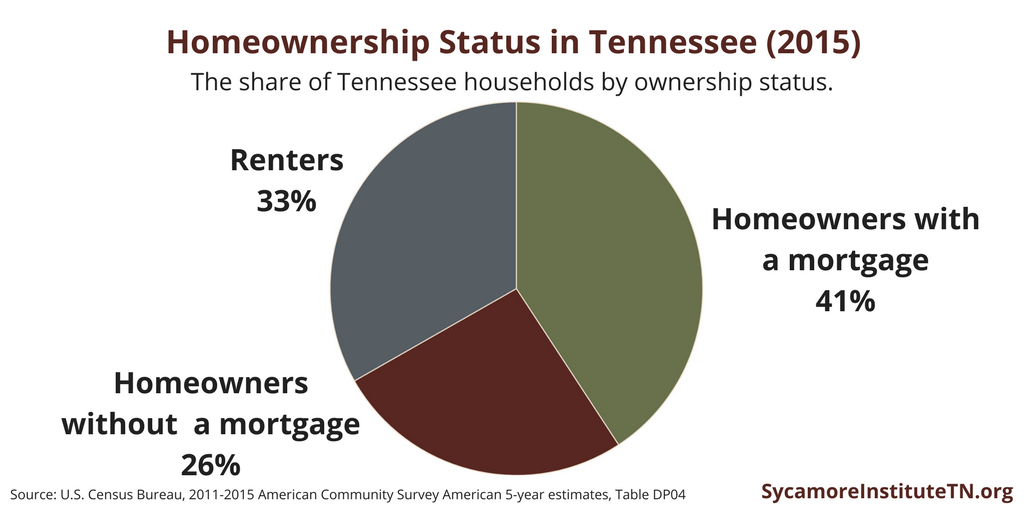
Cost-Burdened Households in Tennessee
Households that spend 30% or more of income on housing are considered “cost-burdened.” Nationwide, renters are more likely to be cost-burdened than homeowners, and low-income households spend more on housing than middle and high-income households. (6) (4)
These trends can be seen in Tennessee as well. In 2015, 41% of Tennessee households owned their home and were paying a mortgage, 26% owned their home and had no mortgage, and 33% were renters (Figure 1). Of these, 29% of homeowner households with a mortgage, 11% of homeowner households without a mortgage, and 51% of renter households were cost-burdened (Figure 2). (5)
Figure 2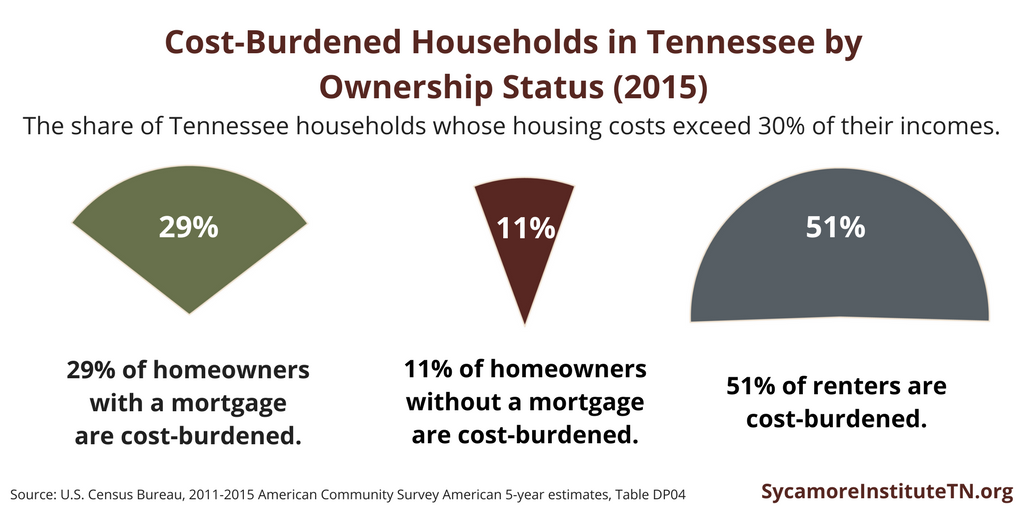
From 2011 to 2015, low-income homeowners and renters in our state consistently spent a larger share of their incomes on housing and were more likely to be cost-burdened than higher-income homeowners and renters. These income-related differences in housing costs are also more pronounced among renters than homeowners (Figure 3).
Figure 3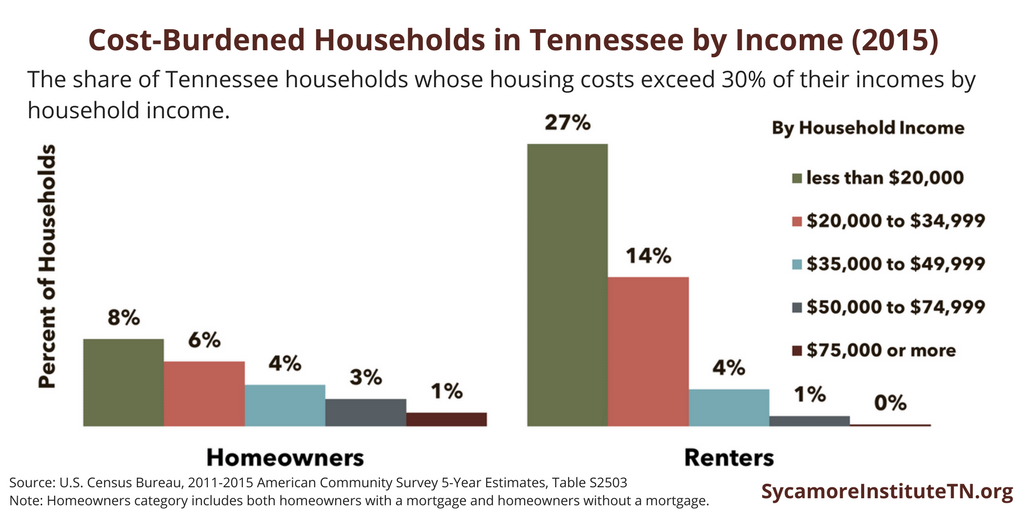
Unaffordable Housing and Health in Tennessee
Research has shown that unaffordable housing is associated with poorer health status, food insecurity, and decreased health care spending. To see if these findings hold true for Tennessee, we looked at the correlation between unaffordable housing in Tennessee and the following metrics: poor physical health days, poor mental health days, poor or fair self-rated health, uninsured rate, and food insecurity. Households were broken down into three groups — owner-occupied households with a mortgage, owner-occupied households with no mortgage, and households paying rent.
Tennessee counties with a higher share of cost-burdened households are more likely to have adverse health outcomes and food insecurity. (7)
- Tennessee counties with a higher share of any type of cost-burdened household were more likely to have:
- A higher percentage of people reporting their health as fair or poor and
- A higher food insecurity rate.
- Tennessee counties with a higher share of cost-burdened homeowner households with or without a mortgage were more likely to have:
- Individuals reporting a greater number of poor mental health days,
- Individuals reporting a greater number of poor physical health,
- A higher rate of smoking, and
- A higher food insecurity rate for households with children.
- Tennessee counties with a higher share of cost-burdened homeowner households with a mortgage were more likely to have a higher adult uninsured rate.
While these findings are consistent with previous research, they do not show a causal relationship between the variables. Our correlation analysis only demonstrates the strength and direction of these relationships. It also does not control for other factors like poverty rates, median incomes, and health behaviors that may be associated with the variables we analyzed. We will dive deeper into these findings with future analyses.
Quality Housing
Housing quality can also impact health. Poor housing conditions are associated with respiratory infections, asthma, lead poisoning, and injuries. Some characteristics of poor quality housing include: lack of complete kitchen or plumbing facilities; exposure to environmental toxins, allergens and pollutants; overcrowding; and lack of clean drinking water. (7) (8)
Research shows:
- Areas with a high concentration of housing code violations (e.g. mold, water damage, cockroaches, and rodents) are associated with increased rates of children with asthma-related emergency department visits and hospitalizations. (9)
- Living in a crowded home is associated with respiratory infections and infectious diseases. Children living in overcrowded homes are more likely to be aggressive, anxious, and experience psychological distress. (10)
- The majority of lead exposure takes place in homes. Lead poisoning causes permanent changes in the brain and causes reading difficulties and decreased intelligence. (10)
- Indoor allergens, damp housing conditions, and pests contribute to the development of asthma and asthma exacerbations. 44% of diagnosed asthma cases among children and adolescents in the United States may be attributed to residential exposures. (11)
- Racial and ethnic minorities and individuals with low-incomes are more likely to live in substandard housing than others. (7)
Figure 4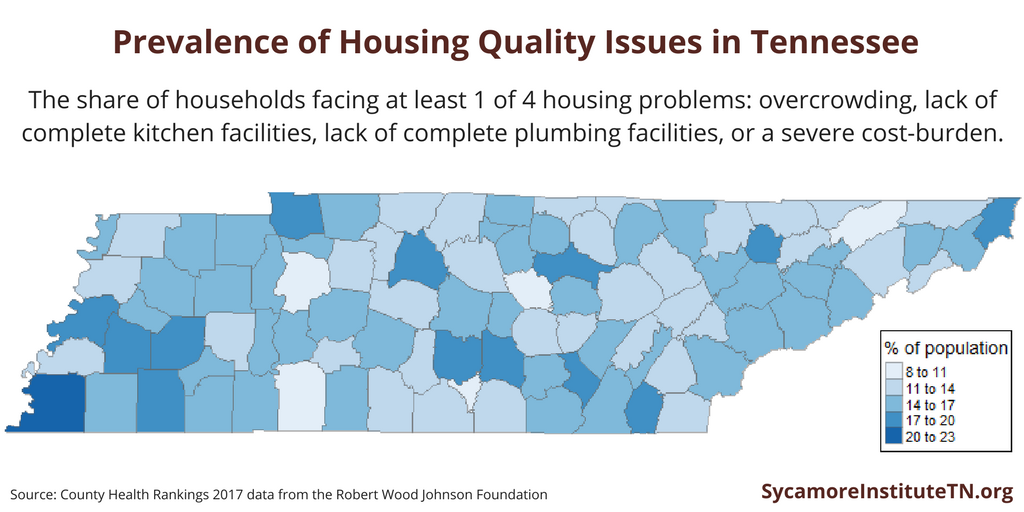
Housing Quality Issues in Tennessee
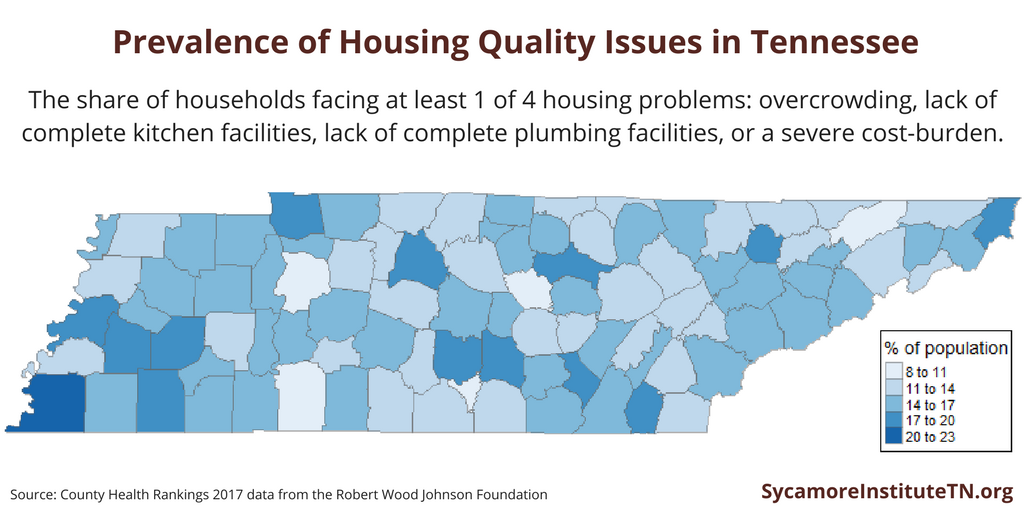
In 2013, sixteen percent of households in Tennessee had 1 of 4 housing problems: overcrowding, lack of complete kitchen facilities, lack of complete plumbing facilities, or a severe cost-burden (monthly housing costs greater than 50% of monthly income). The prevalence of housing problems varies across the state — from a low of 9% in DeKalb County to a high of 21% in Shelby County (Figure 4).
References
Click to Open/Close
1. Pollack, Craig Evan, Griffin, Beth Ann and Lynch, Julia. Housing Affordability and Health Among Homeowners and Renters. American Journal of Preventive Medicine, 39(6), 515-521. [Online] 2010. http://www.ajpmonline.org/article/S0749-3797(10)00455-1/pdf.
2. Maqbool, Nabinah, Viveiros, Janet and Ault, Mindy. The Impacts of Affordable Housing on Health: A Research Summary. Insights from Housing Policy Research, National Housing Conference, Center for Housing Policy. [Online] April 2015. https://www.rupco.org/wp-content/uploads/pdfs/The-Impacts-of-Affordable-Housing-on-Health-CenterforHousingPolicy-Maqbool.etal.pdf.
3. Fletcher, Jason M, Andreyeva, Tatiana and Busch, Susan. Assessing the Effect of Increasing Housing Costs on Food Insecurity. Social Science Research Network. [Online] September 2009. https://papers.ssrn.com/sol3/papers.cfm?abstract_id=1503043
4. Joint Center for Housing Studies of Harvard University. The State of the Nation’s Housing. [Online] 2016. http://www.jchs.harvard.edu/sites/jchs.harvard.edu/files/jchs_2016_state_of_the_nations_housing_lowres.pdf.
5. U.S. Census Bureau. American Community Survey, 5-year estimates. [Online] https://factfinder.census.gov/faces/nav/jsf/pages/index.xhtml.
6. Schanzenbach, Diane Whitmore, et al. Where Does All the Money Go: Shifts in Household Spending Over the Past 30 Years. Brookings Institution, The Hamilton Project. [Online] 2016. https://www.brookings.edu/wp-content/uploads/2016/08/where_does_all_the_money_go.pdf.
7. Krieger, James and Higgins, Donna L. Housing and Health: Time Again for Public Health Action. American Journal of Public Health, 92, 758-768. [Online] 2002. https://www.ncbi.nlm.nih.gov/pmc/articles/PMC1447157/pdf/0920758.pdf.
8. Raymond, Jaime, Wheeler, William and Brown, Mary Hean. Inadequate and Unhealthy Housing, 2007 and 2009. Morbidity and Mortality Weekly Report (MMWR). [Online] 2011. https://www.cdc.gov/mmwr/preview/mmwrhtml/su6001a4.htm.
9. Beck, Andrew F, et al. Housing Code Violation Density Associated with Emergency Department and Hospital Use By Children with Asthma. Health Affair 33(11), 1993-2002. [Online] 2014. https://www.ncbi.nlm.nih.gov/pmc/articles/PMC4458371/.
10. Robert Wood Johnson Foundation. Where We Live Matters for Our Health: The Links Between Housing and Health. Commission to Build a Healthier America. [Online] 2008. http://www.commissiononhealth.org/PDF/e6244e9e-f630-4285-9ad7-16016dd7e493/Issue%20Brief%202%20Sept%2008%20-%20Housing%20and%20Health.pdf.
11. Lanphear, Bruce P, et al. Contribution of Residential Exposures to Asthma in US Children and Adolescents. Pediatrics, 107(6). [Online] 2001. http://centerforhealthyhousing.org/Portals/0/Contents/Article0782.pdf.
12. Srinivasan, Shobha, O’Fallon, Liam R and Dearry, Allen. Creating Healthy Comunities, Healthy Homes, Healthy People: Initiating a Research Agenda on the Built Environment and Public Health. American Journal of Public Health, 93(9). [Online] September 2003. http://courseresources.mit.usf.edu/sgs/ph6934/webpages/CC/module_1/read/1446.pdf.

