Key Takeaways
- Property tax is the largest source of local revenue for county governments in Tennessee.
- The tax rate alone tells us very little about if a county has high or low property taxes.
- Counties’ capacity to raise property tax revenue varies significantly. For example, in 2023, total property market value ranged from $388,000 per capita in Williamson County to $68,000 in Lake.
- County property tax levies totaled about $4.61 per $1,000 of market value in the typical county but varied from a low of $2.22 in Gibson County to a high of $7.65 in Shelby.
- Between 2008 and 2023, property tax capacity increased in most counties while effort and levies declined after adjusting for inflation, but variation between counties was wide.
Property taxes are an important source of revenue for local governments in Tennessee and the second largest piece of Tennesseans’ state and local tax burden. Discussion about this topic often centers on property tax rates. However, the tax rate alone tells us very little about if a county has high or low property taxes. Less attention, however, is given to how these rates relate to differences in underlying property values—known as property tax capacity and effort. Yet property tax rates, capacity, and effort all provide important context for many state and local policy issues. For example:
- State Property Tax Laws — State law dictates how local governments manage aspects of their property taxes, and recent proposals have floated additional changes to if and how local governments can increase their property tax rates.
- State Funding for Local Governments — Property tax capacity is an important part of local government’s overall fiscal capacity—or the ability to raise revenue. Fiscal capacity determines how the state distributes K-12 funding to local governments, but most other state resources are shared with counties using other methods.
- Other Local Revenue Sources — Property tax capacity and effort shape whether and how local governments raise the money they need to provide the programs and services their citizens want. Each local revenue source has trade-offs, and some may have unintended consequences.
This report explores property tax rates and other measures of property tax capacity and effort and how they have changed over the last 15 years to provide context for these and related issues. The Key Terms text box and Appendix provide more information about our terminology, methods, and results.
Background
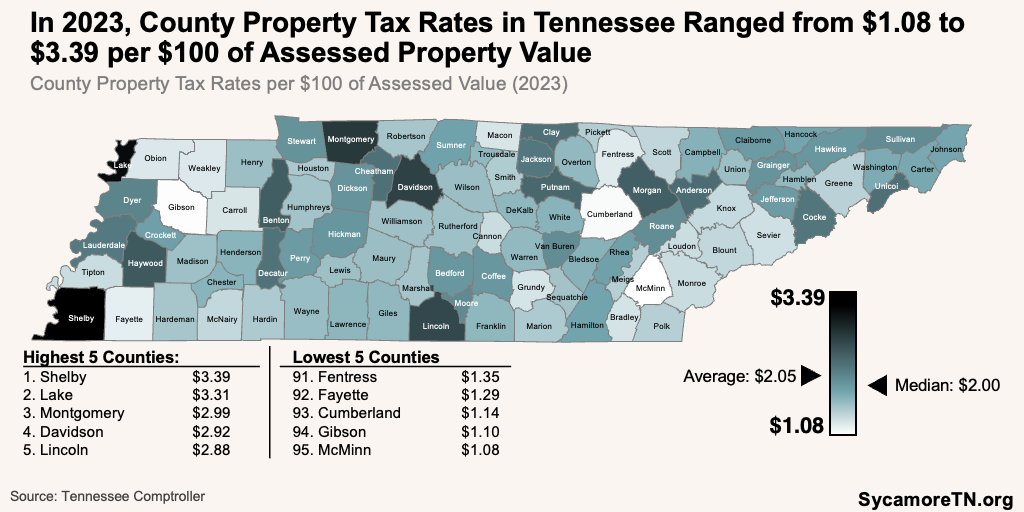
Property tax is the largest source of local revenue for county governments in Tennessee. In FY 2023, property taxes generated $5.8 billion for county governments statewide. These dollars accounted for about 52% of counties’ total local revenues—varying from 30% in Sevier County to 76% in Shelby (Figure 1). (1) (2) (3) (4) (5) The county property tax rates ranged from $1.08 per $100 of assessed property value in McMinn County to $3.39 in Shelby (Figure 2). (6)
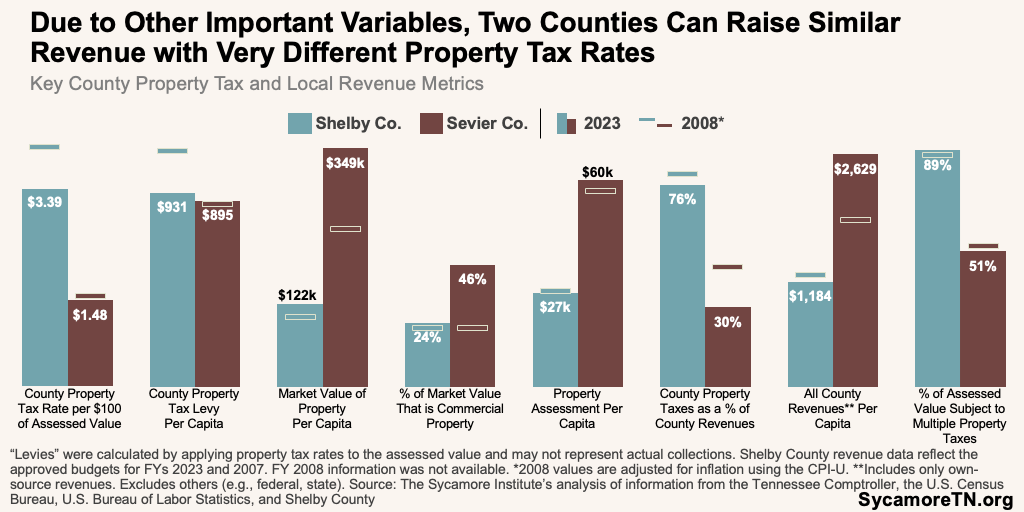
When considering if a local government in Tennessee has a high or low property tax, the rate alone provides limited insight. For the example, two counties can raise similar revenue with very different property tax rates due to other variables like property values and the mix of property types.
Figure 1
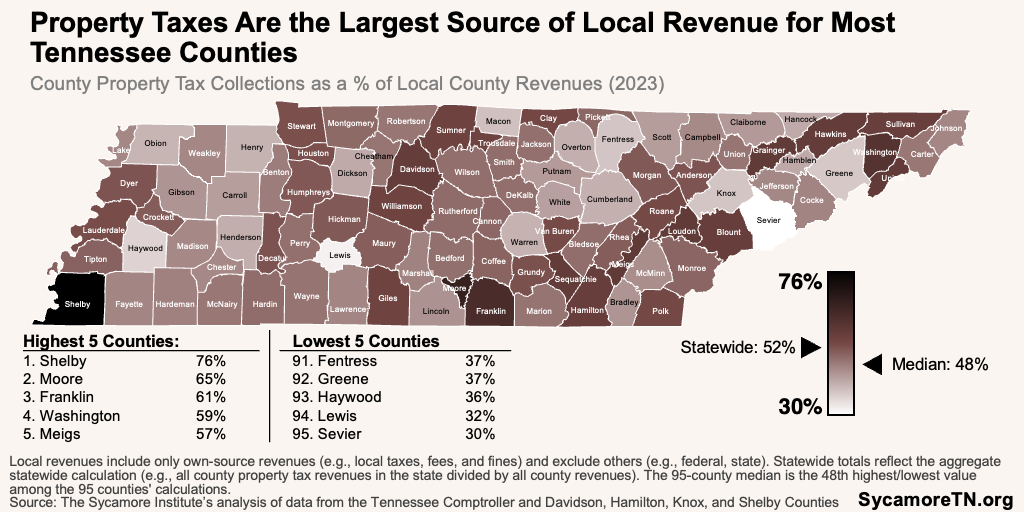
Figure 2
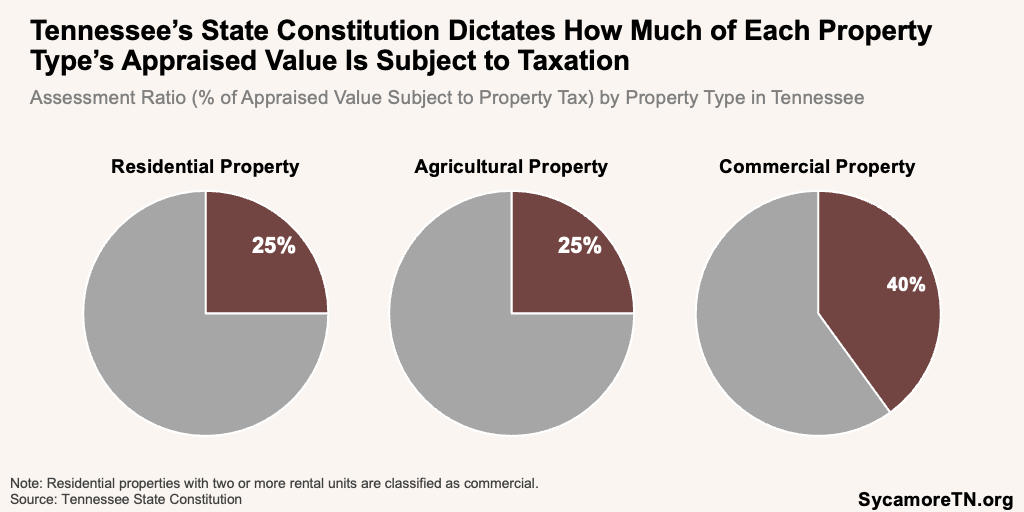
Tax rates combined with information about the tax base provides a fuller picture of a county’s property taxes. Consider, for example, Shelby and Sevier Counties. Shelby’s 2023 property tax rate was $3.39 per $100 of assessed value, while Sevier’s was only $1.48 (Figure 3). However, Sevier’s lower rate generated only about 4% less levy revenue per capita than Shelby’s because of significantly higher property value (i.e., the tax base). Sevier has more commercial property value, more of which is subject to tax than other property types (Figure 4). County property taxes also play a larger role in Shelby County government funding than Sevier. Meanwhile, Sevier’s tourism-based economy generates local sales tax revenues, contributing to much higher per capita county revenues than Shelby County. (6) (7) (1) (2) Throughout this report, “levy” or “levy revenues” refer to the total amount of assessed property value within a taxing authority’s jurisdiction multiplied by that authority’s property tax rate. Levies/levy revenues per capita allow for comparisons across counties. These terms do not refer to actual collections and do not reflect actual or average tax bills or burden. See the Key Terms box and the Appendix for more information.
Figure 3
Some key metrics of county property tax capacity and effort were correlated, but many were not, underscoring the importance of looking at each county’s tax rate in a broader context.
For example, there were no strong associations between 2023 property tax rates and property tax capacity (i.e., assessed values per capita), property tax revenues (i.e., levies per capita), total local revenues, or county reliance on property tax (Figures 5 and 6). (6) (7) Below are key correlations that emerged with meaningful and statistically significant associations. (6) (8) (1) (11) (7) (10) (14) (15) See the Appendix for additional information and Appendix Tables A5 and A6 for full results.
- Higher Market Values, More Market Value Growth — Counties with the highest market values in 2008 tended also to experience the largest per capita market value increases between 2008 and 2023. In other words, areas with higher market value became even more highly valued.
- Larger Population Growth, Bigger Market Value Growth — Counties that experienced the largest jumps in population also tended to have the highest increases in total market and assessed values between 2008 and 2023.
- Larger Assessed Value Growth, Bigger Tax Rate Cuts — Tax rates tended to fall more in counties where assessed value increased the most. This is most likely the result of the state’s “truth-in-taxation” law. Under the law, county property tax rates drop automatically after a reappraisal so that total county property tax collections remain unchanged. This new rate is known as the certified tax rate. If a county wants to tap into any increased appraisal values, the county commission must approve an increase to the certified property tax rate.(16) (17)
- Higher Income, Higher Property Values, Higher Revenues — Higher-income counties tend to have higher property values that generate more revenue at the same tax rate compared to lower-income counties. Household income had no associations with tax rates.
- Higher Capacity, Higher Sales Tax Collections — Counties with higher property tax capacity (i.e., market value per capita) and higher property tax revenues (i.e., levy revenues per capita) also tended to collect more local option sales tax per capita.
- Lower Capacity, Higher Reliance on Other Local Revenues — Counties with lower capacity (i.e., assessed value per capita) and lower property tax revenues (i.e., levy revenues per capita) tended to rely more on non-tax sources of local revenue (e.g., service fees, fines).
Figure 4
Key Terms
Taxing Authorities – Governmental units that may levy property taxes in Tennessee, including counties, municipalities, and some special school districts. Special school districts can only levy property taxes if approved by an act of the General Assembly.
Property Tax Base – Property value subject to taxation within a taxing authority’s jurisdiction. (17)
Property Tax Capacity – The potential to raise revenues from property within a tax authority’s jurisdiction based on the property tax base. Areas will have varying capacities to raise revenues with property tax due to different property values and the mix of property types, which are assessed at unique ratios. Property tax capacity is a component of fiscal capacity, a broader measure of a government’s comprehensive ability to pay for programs and services. In Tennessee, for example, two fiscal capacity calculations are used to determine state and local school funding. (22) (24) (23) (17)
Property Tax Effort – The extent to which a taxing authority taps into its capacity. It does not reflect actual or average tax bills and differs from tax burden, which is defined below. Property tax effort can and has been measured in different ways. Examples include property tax levies as a percent of total market value, assessed value, and/or local gross domestic product (GDP). Another is residential property tax levies as a percent of total personal and/or household income. Tax or fiscal effort measures sometimes attempt to account for differing fiscal needs (e.g., needs programs/services within a jurisdiction), but this report does not. (22) (21) (23) (17)
Market Value – The estimated sale price of a property. (6) (20)
Appraised Value – In Tennessee, the estimated sale price of a property at the time of appraisal/reappraisal. Properties in Tennessee are reappraised on either a 4-, 5-, or 6-year schedule, which varies by county. This process also involves classifying property as residential, agricultural, or commercial. (6) (20) (20)
Appraisal Ratio – Appraised property value as a proportion of market value. A ratio of 1.0 means that the appraised value equals the market value. Gaps between appraised and market values often emerge/grow as more time passes since the last reappraisal. (6) (13) (20)
Assessment Ratio/Rate – The portion of appraised value subject to taxation (Figure 4). (6) (19) (20)
Assessed Value – The value of property subject to taxation (i.e., the appraised value times the assessment ratio/rate). (6) (19) (20)
Property Tax Rate – The rate at which assessed value is taxed—usually expressed as a tax amount per $100 of assessed property value. This type of tax is known as an ad valorem tax (i.e., in proportion to estimated value).
Effective Tax Rate – Taxes as a percentage of market/appraised value. (6) (20) (17)
Property Tax Levy – For this report, the total amount of assessed property value within a taxing authority’s jurisdiction multiplied by that authority’s property tax rate. These calculations are expressed as levies or levy revenues per capita to allow for county comparisons. Levies do not represent actual collections, which may differ based on collection rates and tax credits/relief. It also does not reflect actual or average tax bills and differs from tax burden, which is defined below. This report uses “County Property Tax Levy” to refer to the county government levy. “Local Property Tax Levy” refers to the total levy within a county by both county government and other local taxing authorities. “Local Property Tax Levy Per Capita” is the total levy within the county divided by the total county population and does not represent the actual tax burden.
Tax Burden or Incidence – Tax burden or incidence measures who ultimately pays a tax and how much. For example, individual property owners bear the burden of a residential property tax. Meanwhile, the incidence of property taxes paid by businesses may ultimately fall on some combination of business owners, the labor force, and consumers if tax costs are offset by decreased profits, less hiring or lower wages, and/or higher prices.
Figure 5
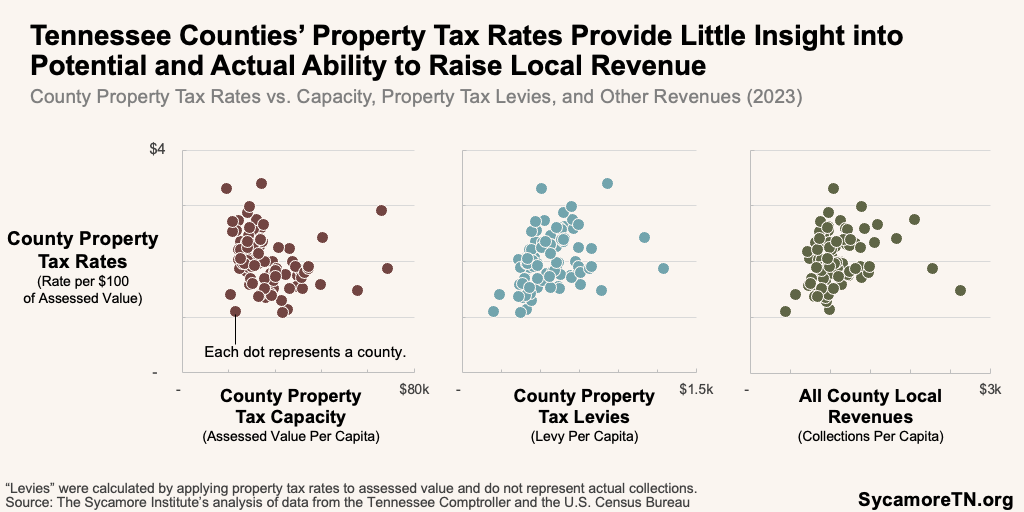
Figure 6
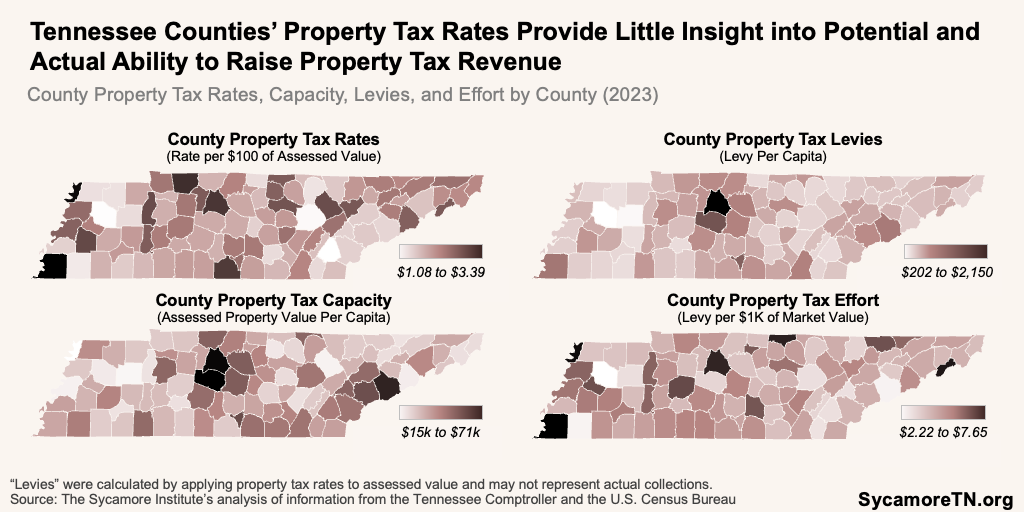
Figure 7
The following sections explore and compare these metrics, changes to property tax capacity and effort over the last 15 years, and if and how these metrics relate to one another and other county-level characteristics. See the Appendix for more information on our methods and findings.
Property Tax Capacity
In 2023, counties’ capacity to raise revenues from property taxes varied significantly (Figure 7). Assessed property value in each county is the most basic measure of property tax capacity. However, a county’s assessed value is the product of each county’s market values, the degree to which local property appraisals reflect market values, and the mix of property types, which are assessed at different rates under the state’s constitution (Figure 4).
Figure 8
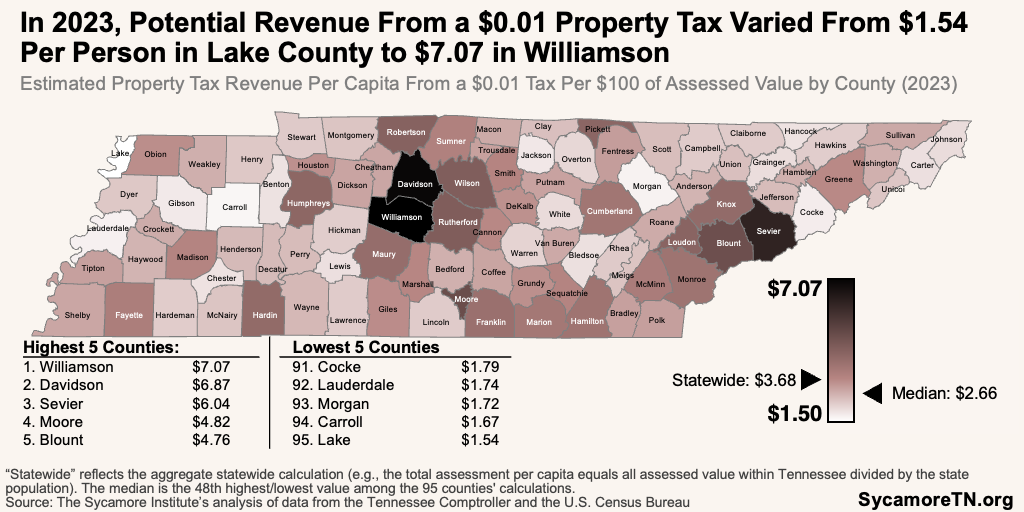
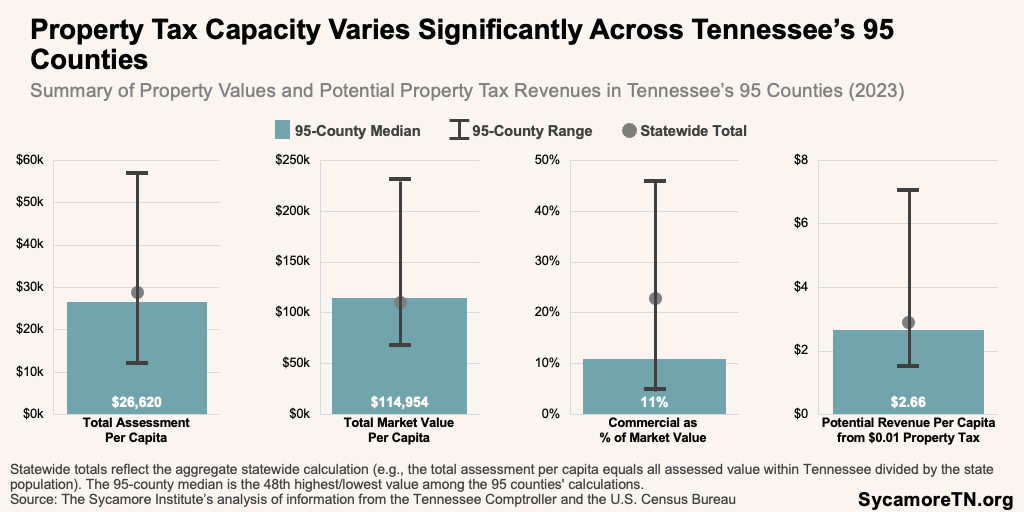
- Assessed Value — The amount of property value that gets taxed (i.e., the assessed value) varied from a high of $70,676 per capita in Williamson County to a low of $15,365 in Lake. This translates to as much as $7.07 of potential revenue per capita for each $0.01 property tax in Williamson County to $1.54 in Lake County (Figure 8). Across all counties, the median per capita assessment was $26,620, or $2.66 of potential revenue per capita for each $0.01 property tax —meaning half of all counties had a higher amount and half less. Figures 9 and 10 display the range of potential revenues per capita relative to the statewide median.(6) (7) See Appendix Table A1 for full results.
- Market Value — The estimated underlying market value of each county’s property varied from $388,000 per capita in Williamson County to as little as $68,000 in Lake (Figure 11).(6) (7) See Appendix Table A1 for full results.
- Appraisal Ratio — Appraised property values were the same as market values in 44 counties (i.e., a ratio of 1.0 or 100%) (Figure 12). Appraisals represented 54%–88% of market values in the remaining counties. This means these counties’ 2023 property tax levies did not tap into the full market value—largely the result of rapid property value increases recently and reappraisals that took place several years ago. More frequent reappraisal cycles tend to keep appraisals more aligned with market values.(6) (13)
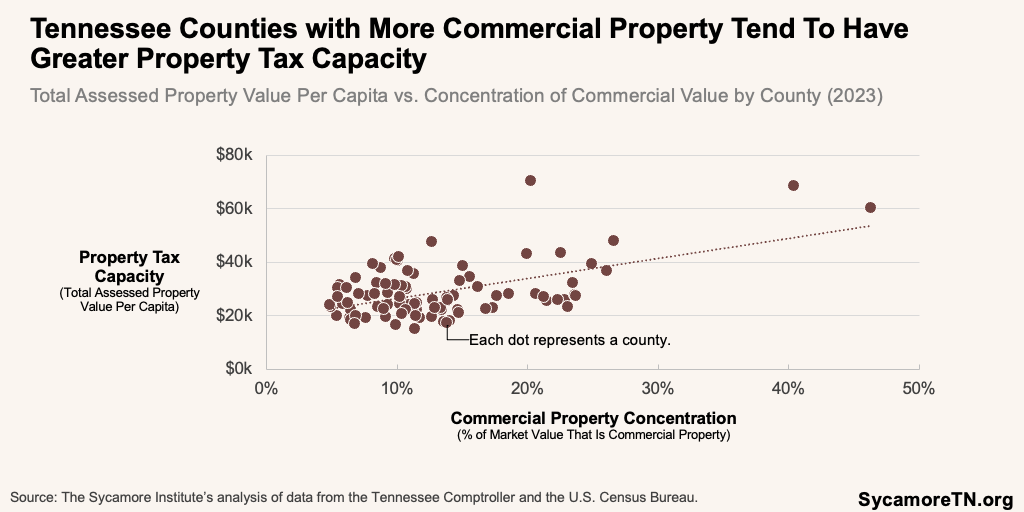
- Commercial Value — Commercial property comprised between 4.8% of the total market value in Union County and 48% in Sevier County (Figure 13). Counties with more commercial property tended also to have higher property tax capacity (Figure 14).(6) Commercial property is assessed at a higher amount than both residential and farm properties. (12) The proportion of a county’s property value that is commercial also affects who bears a county’s property tax burden.
Figure 9
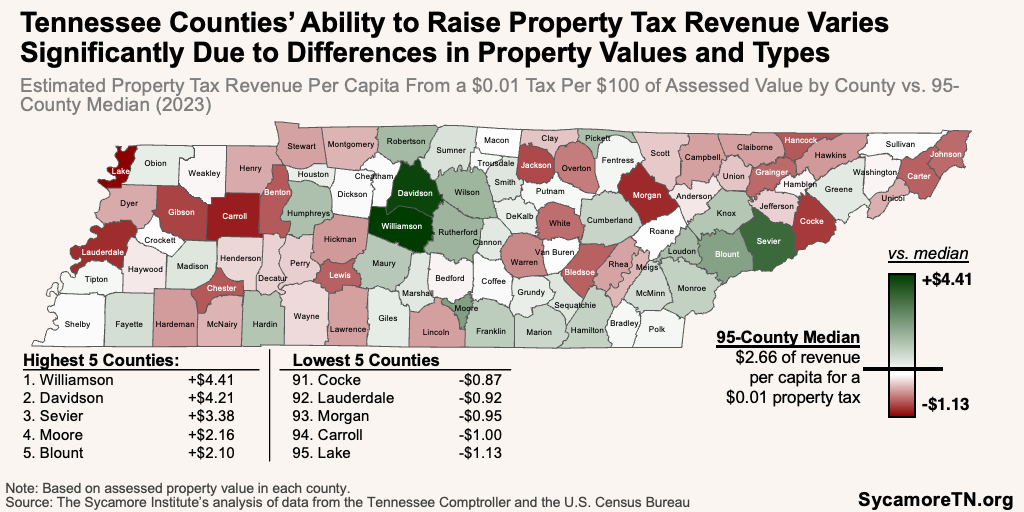
Figure 10
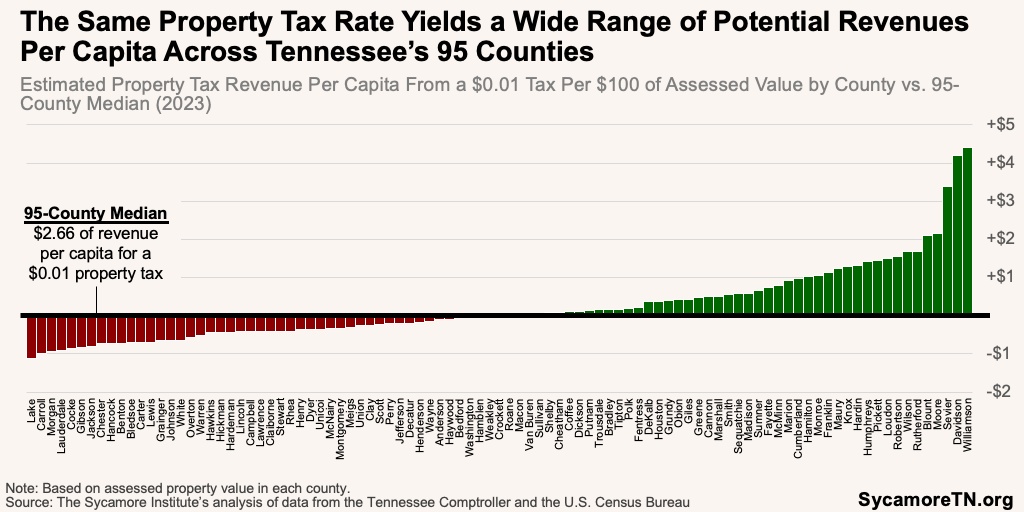
Figure 11
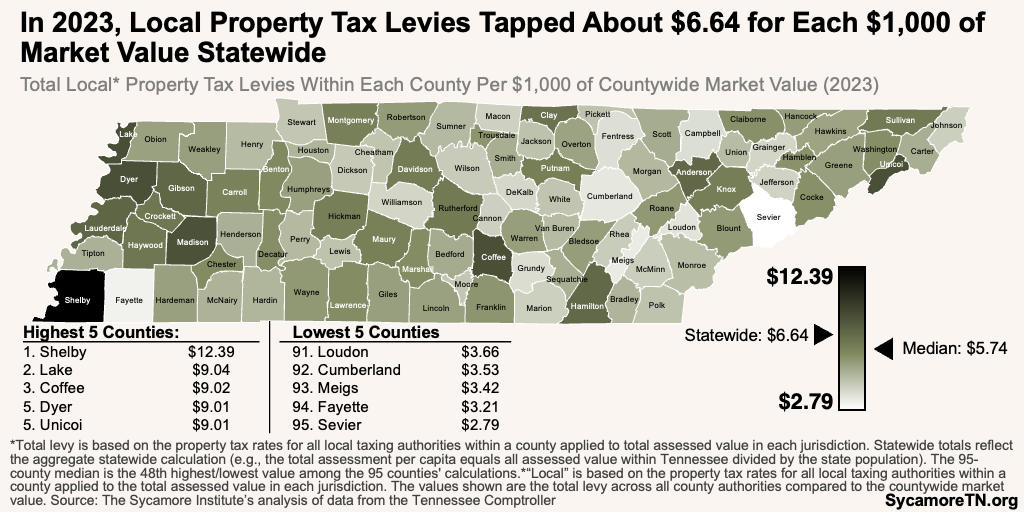
Figure 12

Figure 13

Figure 14
Property Tax Effort
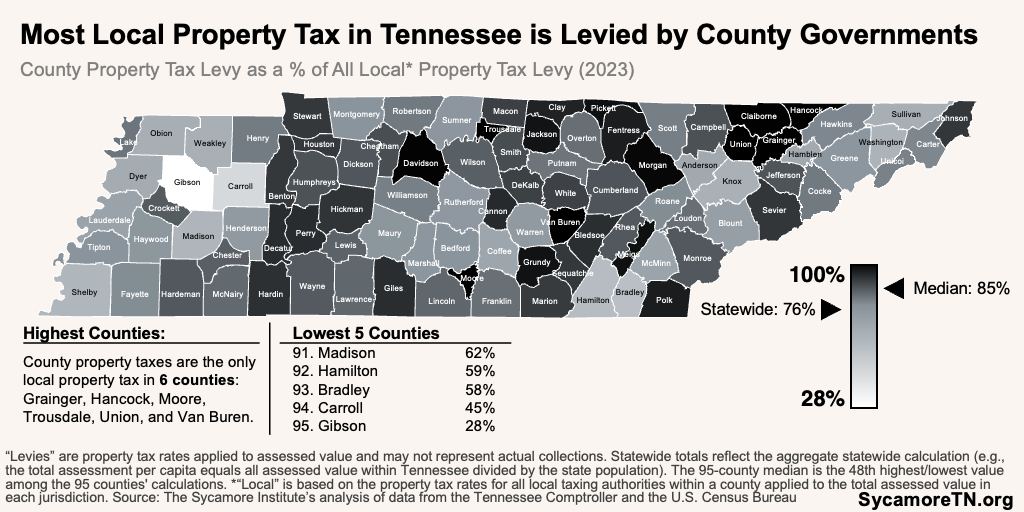
Each of Tennessee’s 95 counties and the local governments within them tap into their property tax capacity at significantly different levels (Figure 15). Although county governments account for most local property tax levies in nearly every county (Figure 16), counties are not the only local governments that levy property taxes. In all but six counties, municipalities and some special school districts levy additional taxes on properties within their jurisdiction. For example, 100% of the assessed value in four counties is subject to multiple property taxes (Figure 17). (6) This means multiple authorities are tapping into the same county property tax capacity. This section highlights several measures of property tax effort by counties and local governments that levy property taxes within each county.
Figure 15
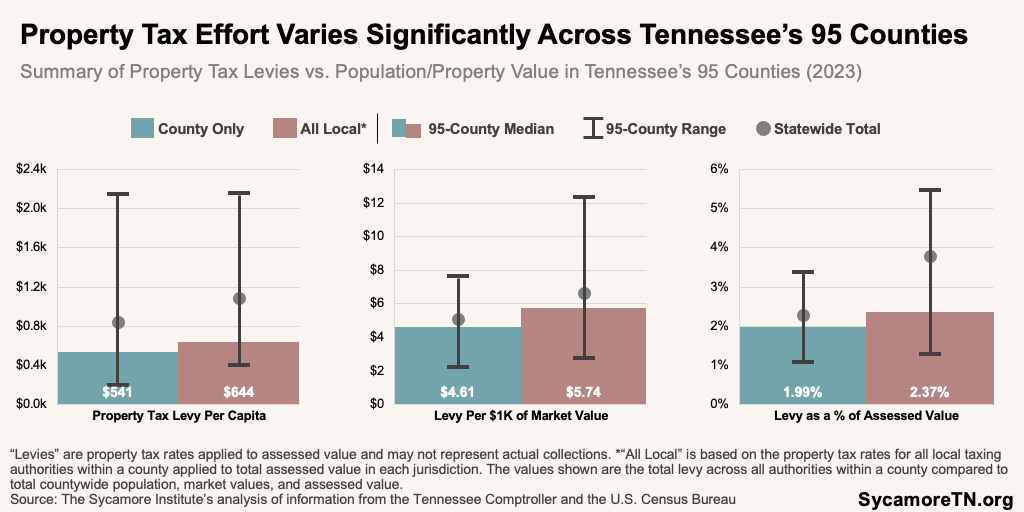
Figure 16
Figure 17
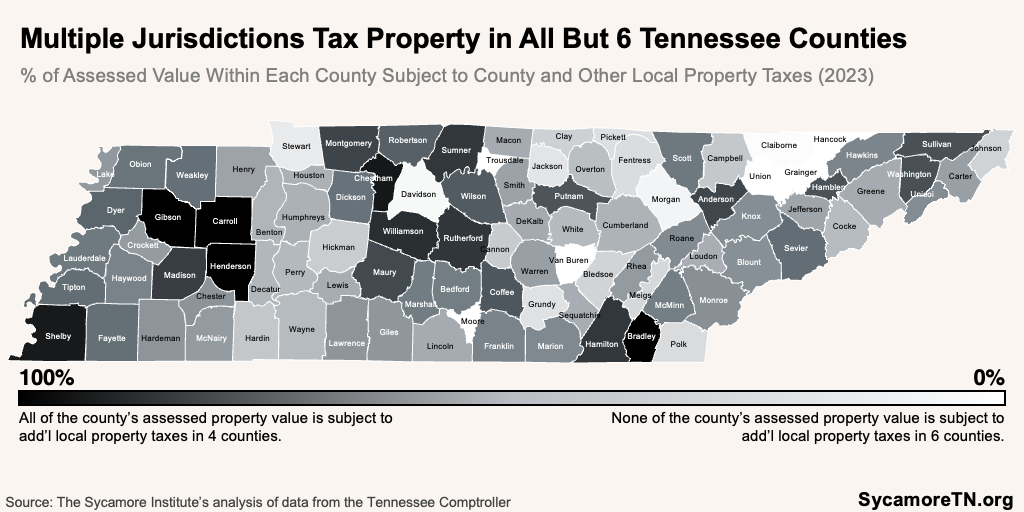
Figure 18
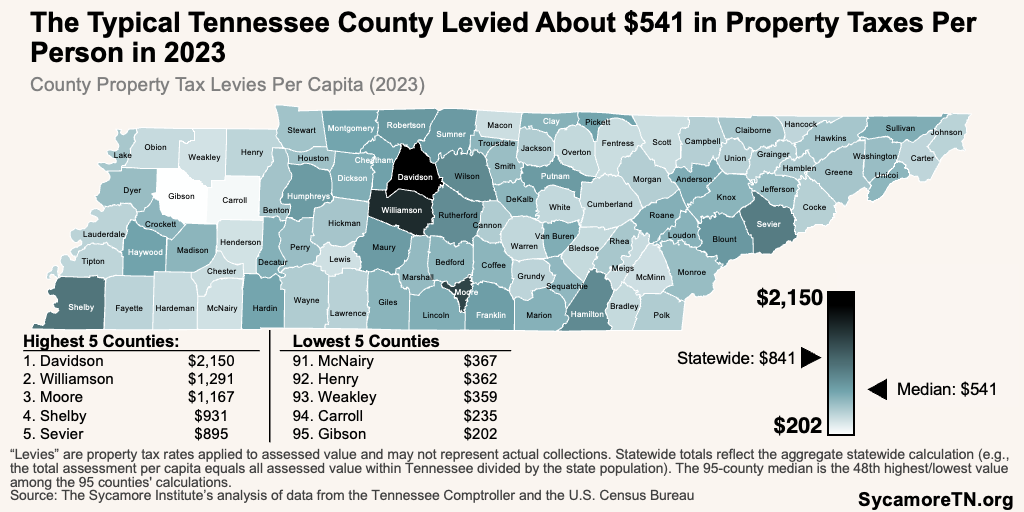
County Property Tax Effort — In 2023, county property tax levies generated about $839 per Tennessean statewide. The typical county levied $541 per capita, ranging from $202 per capita in Gibson County to $2,150 in Davidson (Figure 18). These levies represented about 2.0% of assessed property in a typical county—ranging from a low of 1.08% in McMinn County to 3.39% in Shelby (Figure 19). In the typical county, county levies represented about $4.61 per $1,000 of market value—varying from $2.22 in Gibson County to $7.65 in Shelby (Figure 20). (6) (7) See Appendix Table A2 for full results.
Figure 19
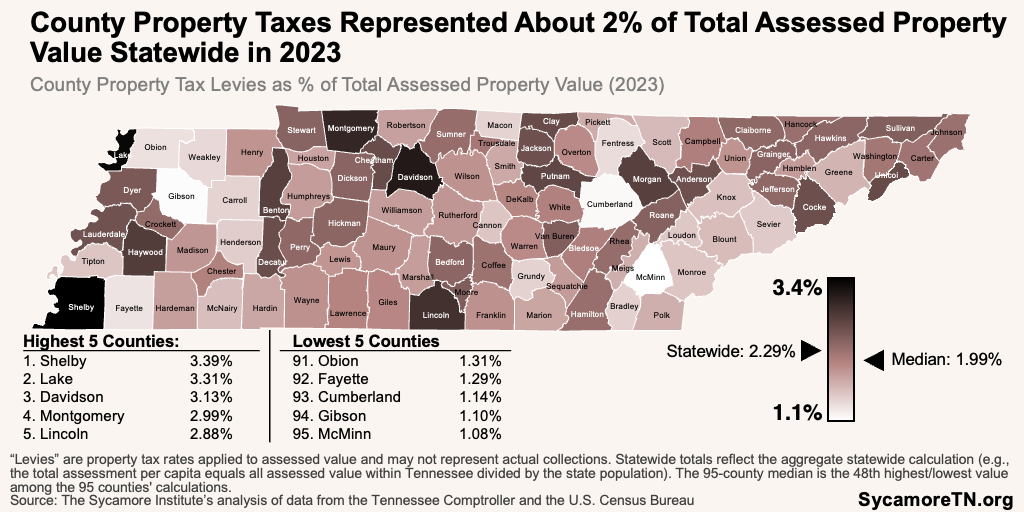
Figure 20
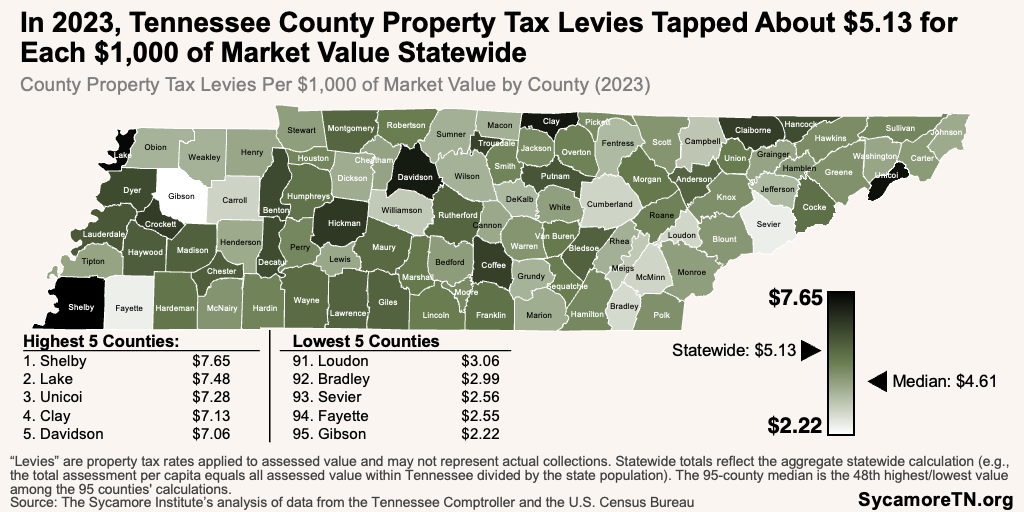
Figure 21
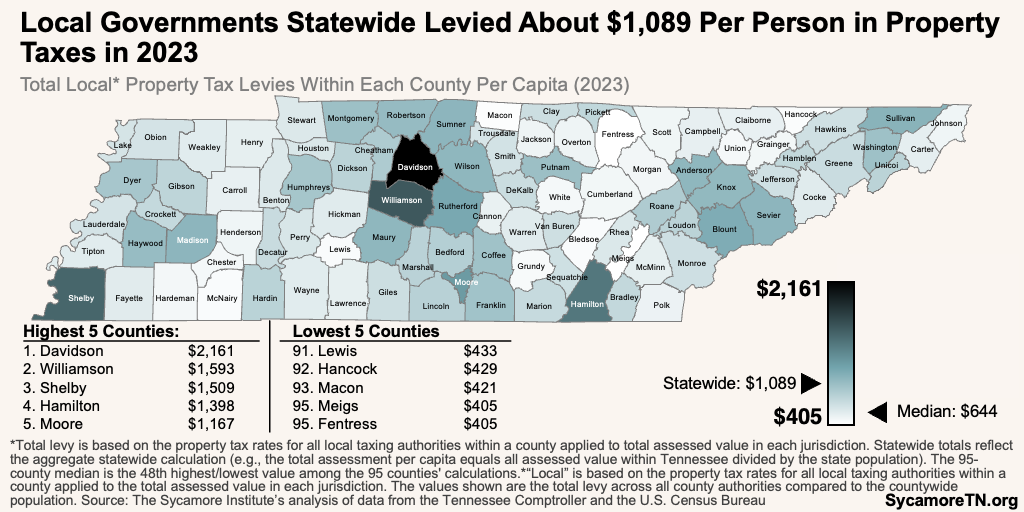
Figure 22
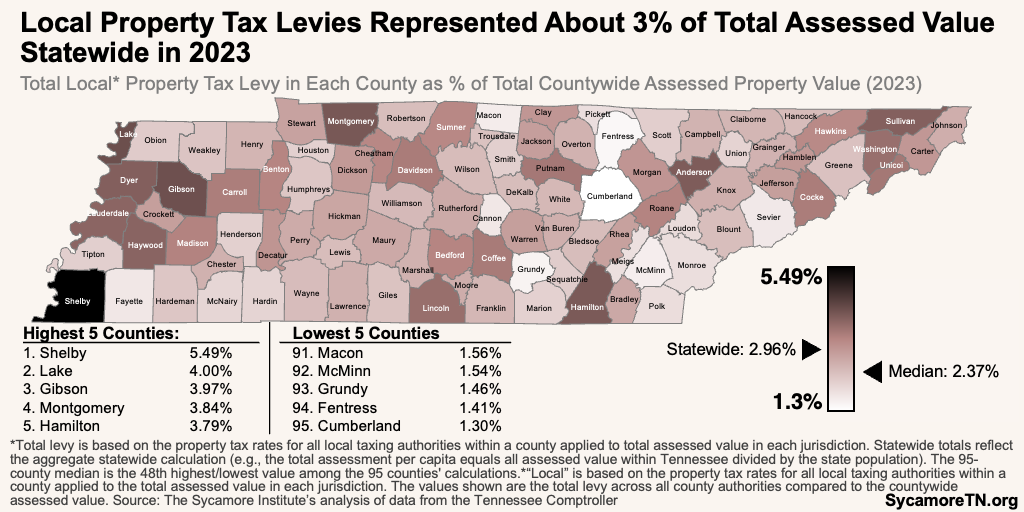
Total Local Property Tax Effort Within Each County — In 2023, local property taxes generated about $1,089 per Tennessean. Local property tax levies within a typical county totaled about $706 per county resident, ranging from $405 per capita in Fentress County to $2,161 in Davidson (Figure 21). These levies represented about 2.4% of the total assessed value in the typical county—ranging from 1.3% in Cumberland County to 5.5% in Shelby (Figure 22). Compared to market value, local property tax levies represented $5.74 per $1,000 of total market value in the typical county—varying from $2.79 per $1,000 of total market value in Sevier County to $12.39 in Shelby (Figure 23). (6) (7) See Appendix Table A3 for full results.
Figure 23
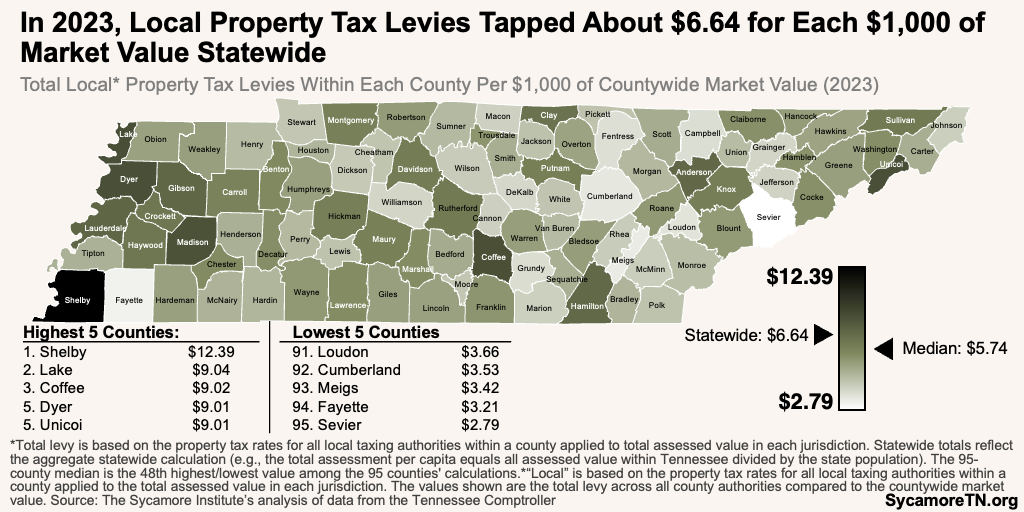
Figure 24
Trends in Property Tax Capacity and Effort
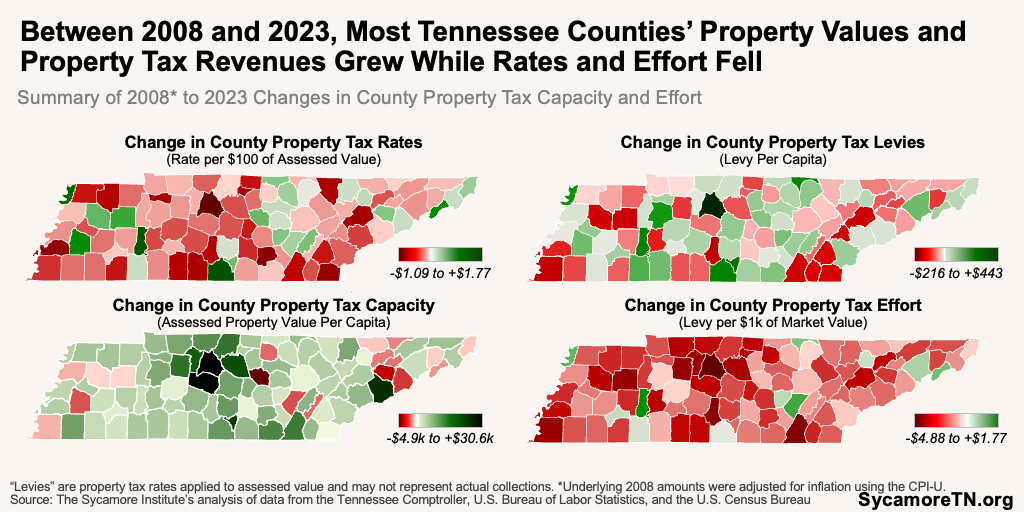
Between 2008 and 2023, most counties experienced increased property tax capacity while effort and levies declined after adjusting for inflation. However, variation between counties was wide (Figures 24 and 25). See Appendix Table A4 for full results.
- Assessed Value — The total assessed property value increased for all but 11 counties between 2008 and 2023 after adjusting for inflation (Figure 26). On a per capita basis, the expected revenues from a $0.01 tax per $100 of assessed property value increased in all but 18 counties (Figure 27).
- Market Value — Total market value increased in 93 counties between 2008 and 2023 after adjusting for inflation. The typical county’s total market value increased 36% (Figure 28).
- Property Tax Rates and Revenues — Seventy counties had lower property tax rates in 2023 than in 2008 (Figure 29). Even with these lower rates, the per capita dollar value of the levies generated by those rates was higher in more than half of the counties than in 2008 (Figure 30).
- Property Tax Effort — Between 2008 and 2023, property tax revenues within each county fell as a share of assessed and market values in most counties (Figures 31 and 32). Had county property taxes captured the same market value as in 2008, 79 counties would have likely collected more revenue (Figures 33 and 34).
Figure 25
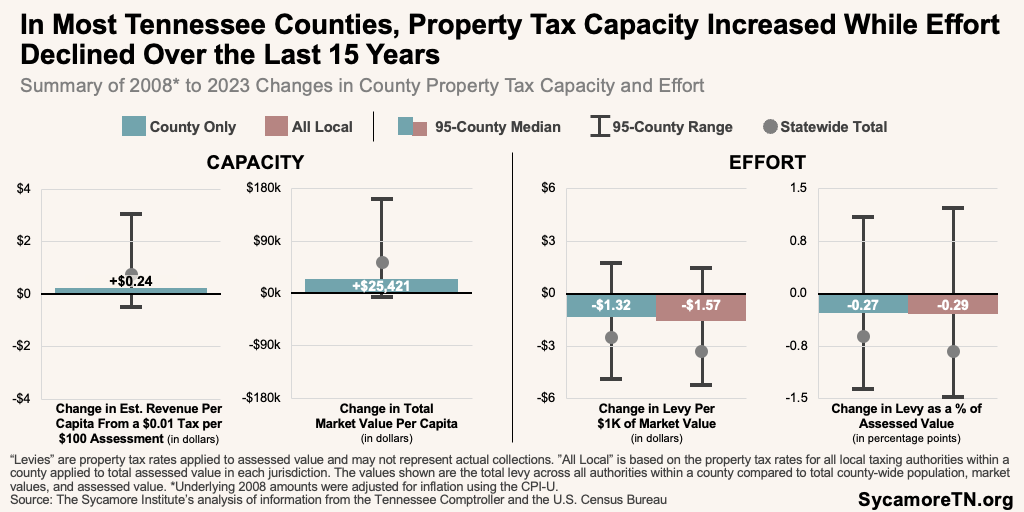
Figure 26
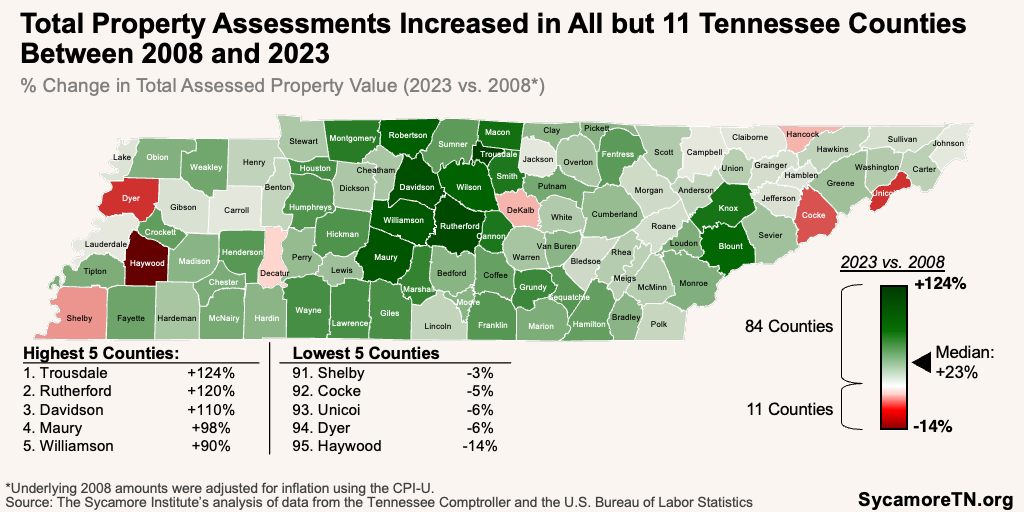
Figure 27
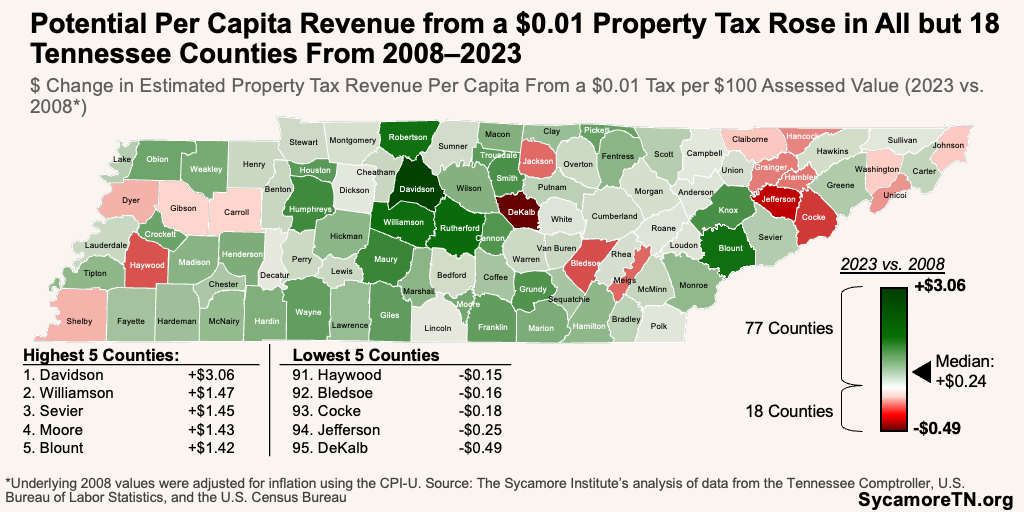
Figure 28
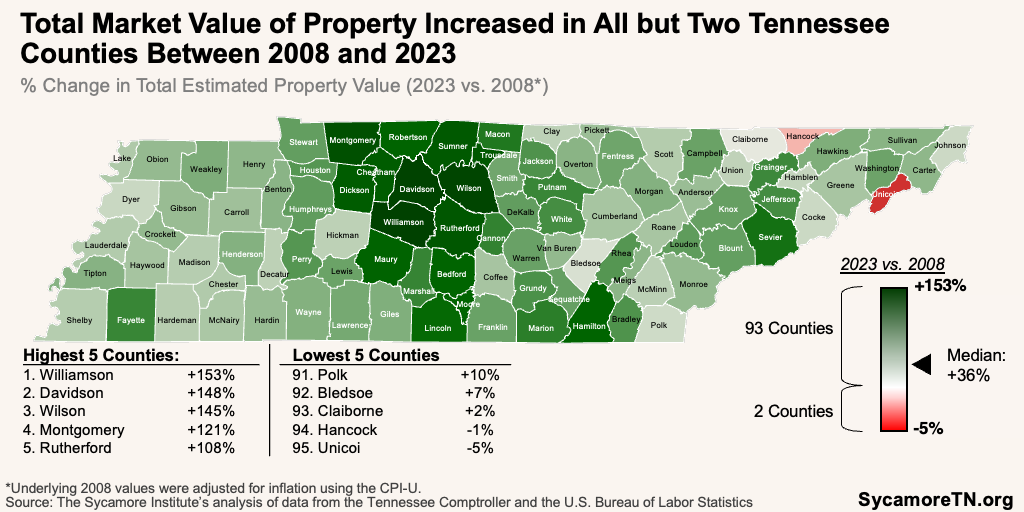
Figure 29
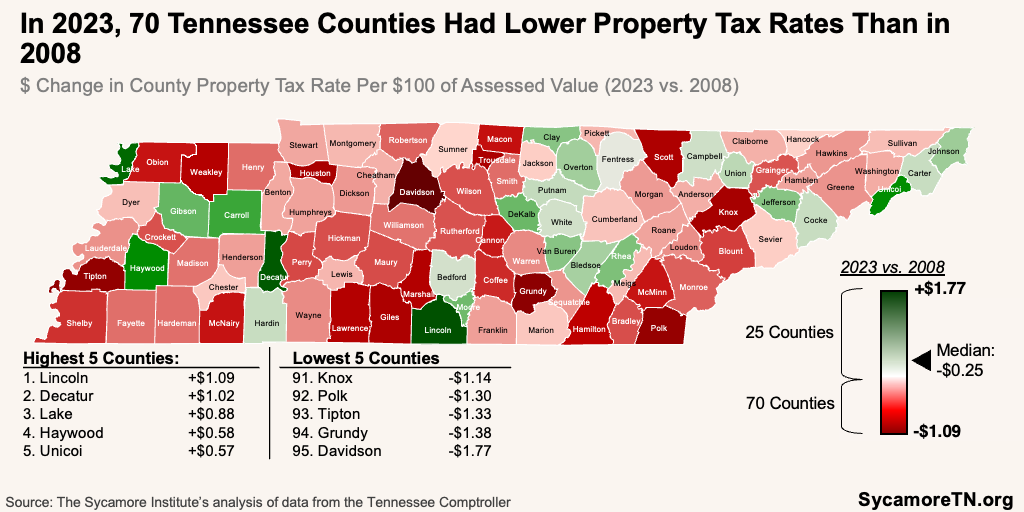
Figure 30
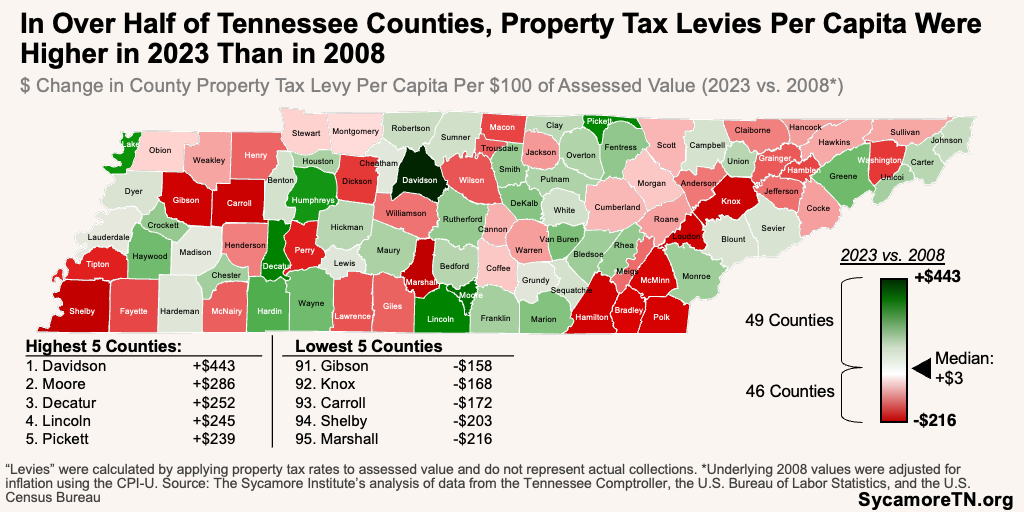
Figure 31
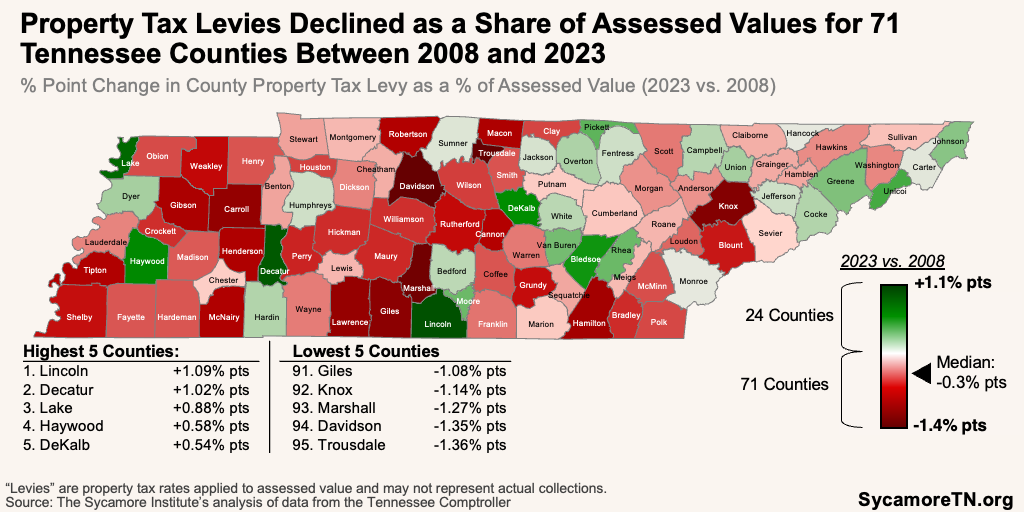
Figure 32
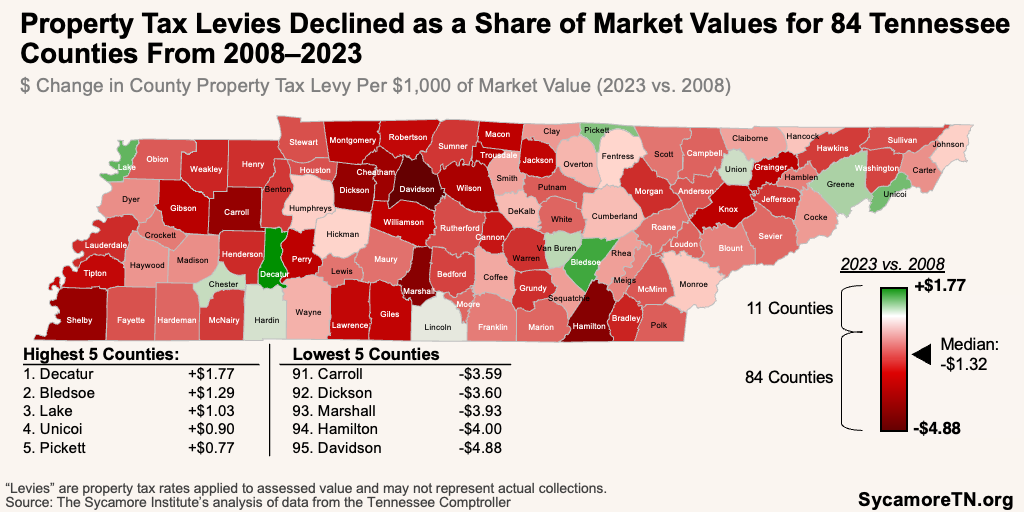
Figure 33
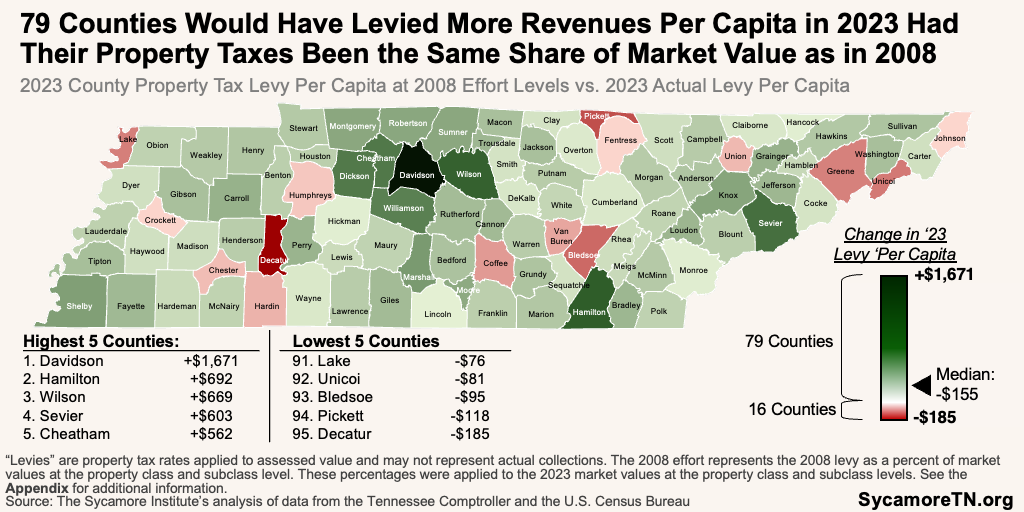
Figure 34
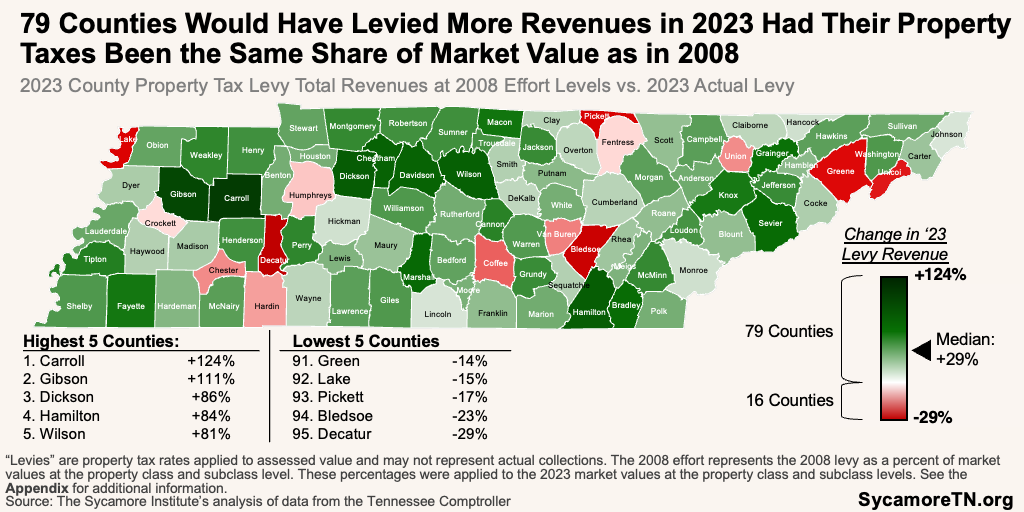
Figure 35
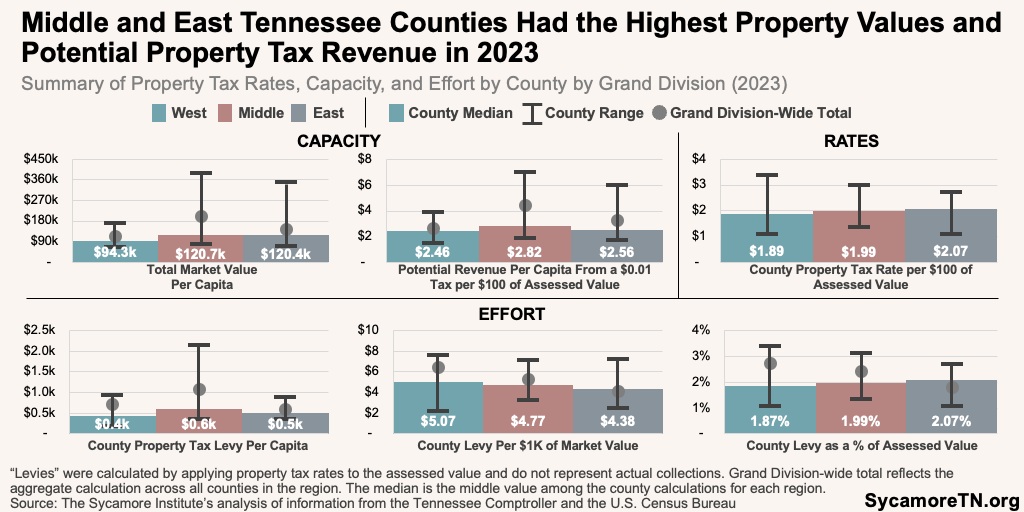
Patterns also emerged across counties in Tennessee’s three Grand Divisions (Figure 35). For example, Middle and East Tennessee counties tended to have higher property values and property tax revenue potential but also much wider variation from county to county within the region. Middle Tennessee counties’ tax rates tended to generate more potential revenue per capita. Still, effort—measured by levy revenues as a percentage of property values—was not that different across the regions.
Parting Words
Each county has unique circumstances that help shape property tax capacity and rates, the ability to tap into other revenue sources, and the revenue needed to meet citizens’ needs. This report highlights key metrics and trends to understand county property taxes in a broader context, particularly as state and local decision-makers consider policies that affect or relate to property taxes.
References
Click to Open/Close
- Tennessee Comptroller of the Treasury. Transparency and Accountability for Governments (TAG) Exports – Revenues 2007-2023. Local Government Audit. https://comptroller.tn.gov/office-functions/la/e-services/tag-tableau/tag-exports.html.
- Shelby County Tennessee. Adopted Budget Fiscal Year 2023 Countywide All Funds Summary. https://www.shelbycountytn.gov/Archive.aspx?ADID=12212.
- The Metropolitan Government of Nashville and Davidson County. Annual Comprehensive Financial Report For The Year Ended June 30, 2023. June 2024. https://www.nashville.gov/sites/default/files/2024-06/2023_Annual_Comprehensive_Financial_Report_Final_6.25.24.pdf?ct=1719506888.
- Hamilton County Tennessee. Annual Comprehensive Financial Report For The Year Ended June 30, 2023. March 2024. https://comptroller.tn.gov/content/dam/cot/la/advanced-search/2023/other/1478-2023-CN-hamiltonco-rpt-cpa764-3-25-24.pdf.
- Knox County Tennessee. Annual Comprehensive Financial Report For The Year Ended June 30, 2023. June 2024. https://comptroller.tn.gov/content/dam/cot/la/advanced-search/2023/other/1492-2023-cn-knoxco-rpt-cpa225-1-31-24.pdf.
- Tennessee Comptroller of the Treasury. 2023 Tax Aggregate Report of Tennessee. State Board of Equalization. https://comptroller.tn.gov/content/dam/cot/pa/documents/tax-aggregate-reports/2023TaxAggregateReport.pdf.
- U.S. Census Bureau. Annual Estimates of the Resident Population for Counties: April 1, 2020 to July 1, 2023 (CO-EST2023-POP). 2023. https://www.census.gov/data/tables/time-series/demo/popest/2020s-counties-total.html.
- Tennessee Comptroller of the Treasury. 2008 Tax Aggregate Report of Tennessee. State Board of Equalization. Provided to The Sycamore Institute upon request.
- Shelby County Tennessee. Adopted Fiscal Year 2007 Countywide Summary. https://www.shelbycountytn.gov/Archive.aspx?AMID=&Type=&ADID=78.
- U.S. Census Bureau. Intercensal Estimates of the Resident Population for Counties: April 1, 2000 to July 1, 2010. 2010. https://www.census.gov/data/tables/time-series/demo/popest/intercensal-2000-2010-counties.html.
- U.S. Bureau of Labor Statistics. U.S. Bureau of Labor Statistics, Consumer Price Index for All Urban Consumers: All Items in U.S. City Average [CPIAUCSL]. Retrieved from FRED, Federal Reserve Bank of St. Louis. https://fred.stlouisfed.org/series/CPIAUCSL.
- State of Tennessee. State Constitution. 2023. https://publications.tnsosfiles.com/pub/2023%20TN%20Constitution.pdf.
- Tennessee Comptroller of the Treasury. Video: The Rundown on Ratios and Equalization. January 2023. https://youtu.be/ssNJhONl50I?feature=shared.
- U.S. Census Bureau. 2022 Small Area Income and Poverty Estimates (SAIPE). 2023. https://www.census.gov/data-tools/demo/saipe/#/?s_state=47&s_county=&s_district=&s_geography=county&s_measures=mhi.
- —. County-Level Urban and Rural information for the 2020 Census. September 2023. https://www.census.gov/programs-surveys/geography/guidance/geo-areas/urban-rural.html.
- Tennessee Comptroller. Property Tax Reappraisal and Certified Tax Rate. State Board of Equalization. https://comptroller.tn.gov/boards/state-board-of-equalization/sboe-resources/certified-tax-rate.html.
- Green, Harry, Chervin, Stan and Lippard, Cliff. The Local Government Finance Series, Volume I: The Local Property Tax in Tennessee . Tennessee Advisory Commission on Intergovernmental Relations (TACIR). February 2002. https://www.tn.gov/content/dam/tn/tacir/documents/LOCAL_PROPERTY_TAX.pdf.
- Akoglu, Haldun. User’s Guide to Correlation Coefficients. Turk J Emerg Med 18(3): 91-93. September 2018. https://www.ncbi.nlm.nih.gov/pmc/articles/PMC6107969/#bib4.
- Tennessee Comptroller of the Treasury. Assessment v. Taxation. Division of Property Assessments. https://comptroller.tn.gov/office-functions/pa/property-taxes/assessment-vs-taxation.html.
- —. Defining Tennessee Property Assessments: A Glossery of Property Assessment Terms. Division of Property Assessments. 2018. https://comptroller.tn.gov/office-functions/pa/property-taxes/tennessee-property-assessment-glossary.html.
- New York City Independent Budget Office. Taxing Metropolis: Tax Effort and Tax Capacity in Large U.S. Cities. February 2000. https://www.ibo.nyc.ny.us/iboreports/taxcapacity222.pdf.
- Chervin, Stanley. Fiscal Effort, Fiscal Capacity, and Fiscal Need: Separate Concepts, Separate Problems. Tennessee Advisory Commission on Intergovernmental Relations (TACIR). June 2007. https://www.tn.gov/content/dam/tn/tacir/documents/effort_capacity_need.pdf.
- Temple University Center on Regional Politics. Understanding Measures of Tax Effort and Tax Capacity. April 2015. https://sites.temple.edu/corparchives/files/2019/08/Tax-Effort-and-Capacity-Brief-Web.pdf.
- Gordon, Tracy, Auxier, Richard and Iselin, John. Assessing Fiscal Capacities of States: A Representative Revenue System–Representative Expenditure System Approach, Fiscal Year 2012. Urban Institute. March 2016. https://www.taxpolicycenter.org/sites/default/files/publication/140136/2000646-assessing-fiscal-capacities-of-states-a-representative-revenue-system-representative-expenditure-system-approach-fiscal-year-2012.pdf.


