

Key Takeaways
- Basic needs in Tennessee cost significantly more than federal poverty thresholds.
- Incomes and the costs of some basic needs in Tennessee have increased faster than inflation since 2019.
- Rates of financial hardship in Tennessee generally declined between 2019 and 2024, but changes in the number of affected households and people were more mixed across counties.
- In 2024, about 1.2 million Tennessee households (or 41%) may have struggled to afford basic needs—including about 943,000 individuals (or 13.3%) in poverty.
- Available data, however, do not capture the cost and income effects of more recent conditions that could affect financial well-being in either direction.
The decisions made by Tennessee’s next governor and General Assembly will shape the state’s future for years to come. Throughout the remainder of 2026, the Sycamore Institute will release a series of concise, evidence-based insights drawn from our past research to provide context on the policies, trends, and challenges that could define Tennessee’s next chapter. Each brief offers an accessible overview of an important issue and, in some cases, links to deeper analysis for those who want to explore it further.
This brief focuses on income, affordability, and financial hardship in Tennessee—including how we measure these things and 4 key takeaways from the most recent data available on income and costs in Tennessee.
Measuring Financial Well- Being
Various measures of income and economic well-being offer different insights into Tennesseans’ ability to afford basic needs and achieve economic security. No single measure tells the whole story, but popular measures provide answers to different questions about households’ economic circumstances. Here are some of the measures we use and expound upon in this brief:
- Wages tell us what workers earn. Wage measures capture earnings from work, but do not account for earnings of other household members or income from sources other than employment.
- Income gives us a picture of most (but not all) of the resources available to households receive. Income metrics capture both earnings and other cash income (e.g., Social Security, interest, retirement income). They do not, however, capture all income sources and noncash benefits that can help households meet their needs. Summary measures like median household income can also mask variation across households.
- Poverty tells us who has very low incomes relative to a common, national benchmark. The official poverty measure offers a standard, national metric of how many people and households have especially limited incomes. Because it is based on the same income measure above, it excludes some public benefits that help families meet needs. In fact, it is often used to determine eligibility for those benefits. However, poverty thresholds do not reflect differences in the cost of living across places or the changes in the costs of necessities like housing, health care, and childcare.
- Other measures like ALICE estimate what it costs to get by relative to household incomes. For example, the United Way’s ALICE (Asset Limited, Income Constrained, Employed) survival budget estimates local costs of expenses like housing, food, transportation, health care, and childcare for different household types. ALICE then estimates how many households have incomes below those amounts. This provides a broader view of financial hardship than the official poverty measure, but because ALICE relies largely on the same income concepts as above, it does not capture every resource or benefit available to a household.(1)
Other factors like household wealth and debt can also significantly affect families’ ability to afford basic needs and weather unexpected costs but are beyond the scope of this brief.
See more insights on common economic measures in 5 Ways to Measure Prosperity in Tennessee. Prior work on medical debt and debt collection lawsuits can be found here.
1. Basic Needs in Tennessee Cost Significantly More Than Federal Poverty Thresholds.
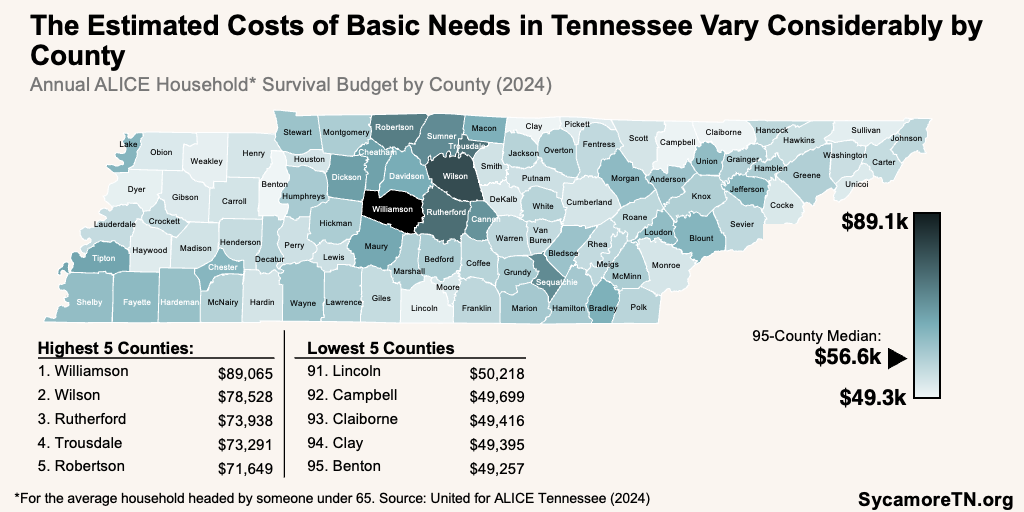
ALICE’s estimated Tennessee household survival budgets were between 85% and 164% higher than federal poverty thresholds in 2024—depending on household type (Figure 1). Today’s official federal poverty measure was developed in the 1960s based on 1963 food costs and spending patterns showing that food accounted for about one-third of household expenses. (2) Today, however, food accounts for a much smaller share of household spending, while the costs of other necessities have grown and can vary significantly by local market. (3) ALICE’s household survival budget estimates illustrate the role of costs like housing, childcare, transportation, and health care (Figure 1) and the variation within Tennessee (Figure 2).
Figure 1
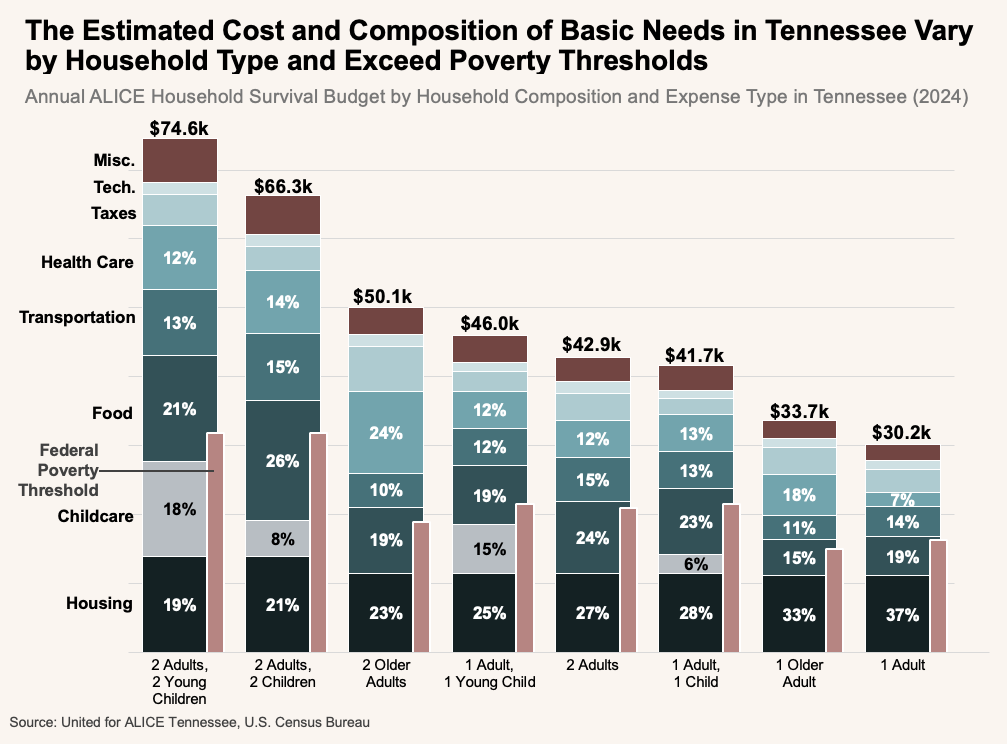
Figure 2
2. The Costs for Many Major Categories of Household Spending Have Increased Faster Than Inflation in Recent Years.
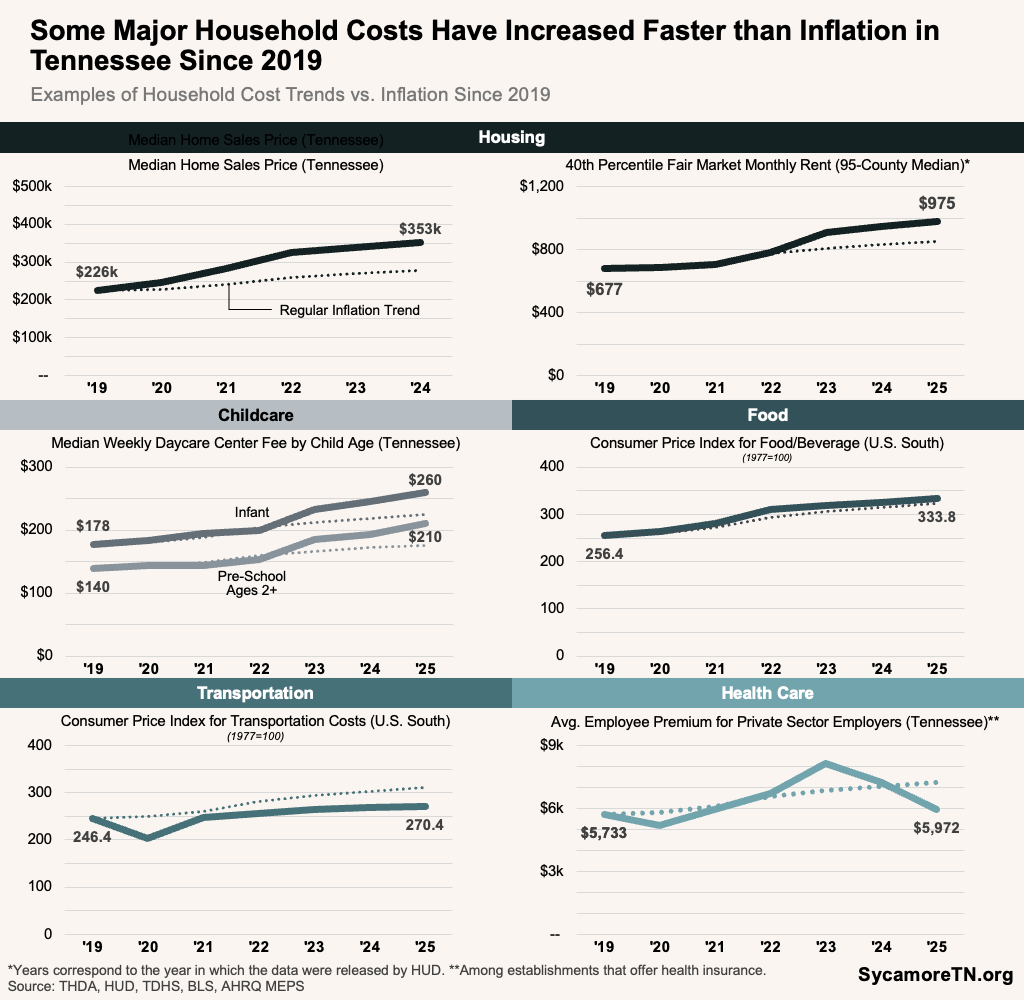
State and regional-level data suggest that major categories of household spending like housing, childcare, and food have all grown faster than regular inflation since before the pandemic (Figure 3). State-level data on the major drivers of a household’s budget are not uniformly available across all categories, but what is available gives some insights into cost trends in and across Tennessee. For context, regular inflation—known as the CPI-U—grew by 23% between 2019-2024 and by 26% between 2019-2025. (9) By comparison:
- Housing — Median home sales prices statewide increased by 56% between 2019-2024, and the 95-county median fair market rent[1] grew by 44% between 2019-2025. (5) (6) Had these costs grown with regular inflation during that time, median home sales prices would have been 21% lower in 2024 and fair market rents 13% lower in 2025.
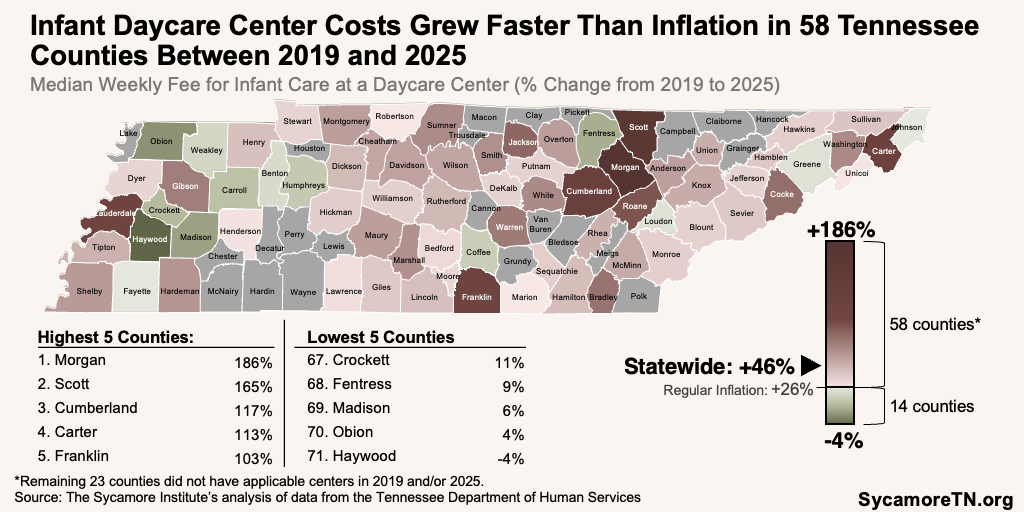
- Childcare — The statewide median weekly fee for an infant in a daycare center grew 46% between 2019-2025.(7) Had these costs tracked with regular inflation, they would have been 14% lower in 2025.
- Food — The cost of food and beverage in the Census’ U.S. South region—which includes 16 states—increased by 30% between 2019-2025.(8) This measures the change in prices for a specific market basket of grocery, restaurant, and beverage purchases based on actual consumer spending habits. Had these costs grown with regular inflation, they would have been 3% lower in 2025.
- Transportation — The cost of transportation in the U.S. South increased by 10% between 2019-2025.(8) This measures the change in costs to buy, maintain, and use personal vehicles and for public transportation based on actual consumer spending habits. Had these costs grown with regular inflation, they would have been 15% higher.
- Health Insurance — Tennessee private employers’ average employee premium for family coverage increased by 26% between 2019-2024 and, due to a decline in 2025, by 4% between 2019-2024.(10) Had these costs kept pace with regular inflation, 2025 premiums would have been 21% higher. These costs fluctuated over this time period significantly. They also do not represent all out-of-pocket health care spending (e.g., deductibles, co-pays, co-insurance) and reflect only one sector, where about 53% of Tennesseans got coverage in 2024.
Figure 3
The growth in housing and childcare costs varied significantly by location in Tennessee but exceeded inflation in most counties. Available county-level data on these two major areas of household spending show:
- Growth in median home sales prices between 2019 to 2024 outpaced inflation in every county—ranging from a 26% increase in Haywood County to 131% in Pickett County (Figure 4). (5)
- Increases in area rents for a 2-bedroom unit between 2019 and 2025 also exceeded inflation in every county—from as little as a 26% increase in Hickman County to as much as 67% in Hamilton, Marion, and Sequatchie Counties (Figure 5). (6)
- The change in infant care costs at daycare centers between 2019 and 2025 was greater than inflation in 58 out of 72 counties with applicable centers in both years—varying from a 4% decline in Haywood County to a 186% jump in Morgan County (Figure 6). (7)
To read more about inflation, housing costs, and childcare, see How Inflation Affects Tennessee’s State & Local Governments, Tennessee’s Housing Challenges: Where and Why It Got So Expensive, and Childcare in Tennessee.
Figure 4
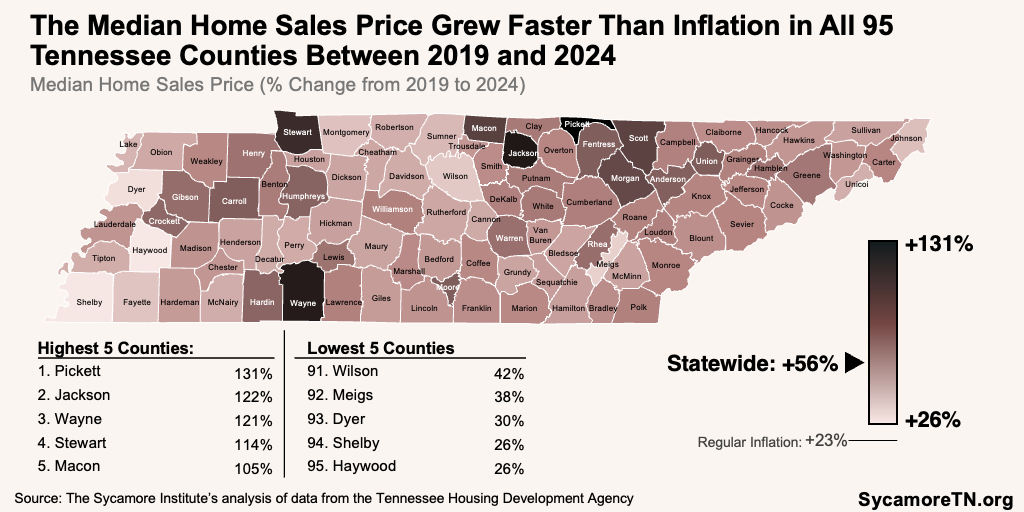
Figure 5
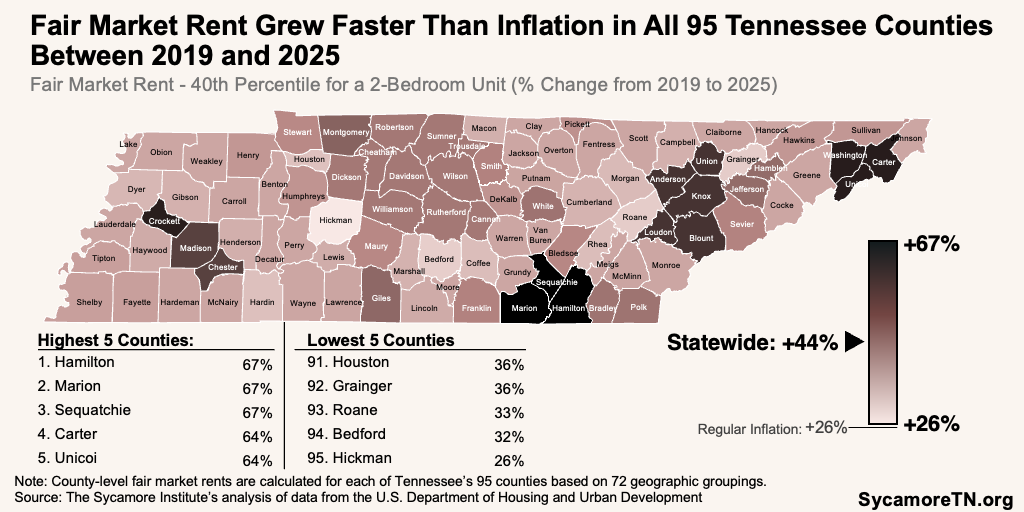
Figure 6
3. Most Wages and Incomes in Tennessee Also Grew Faster Than Inflation Since 2019.
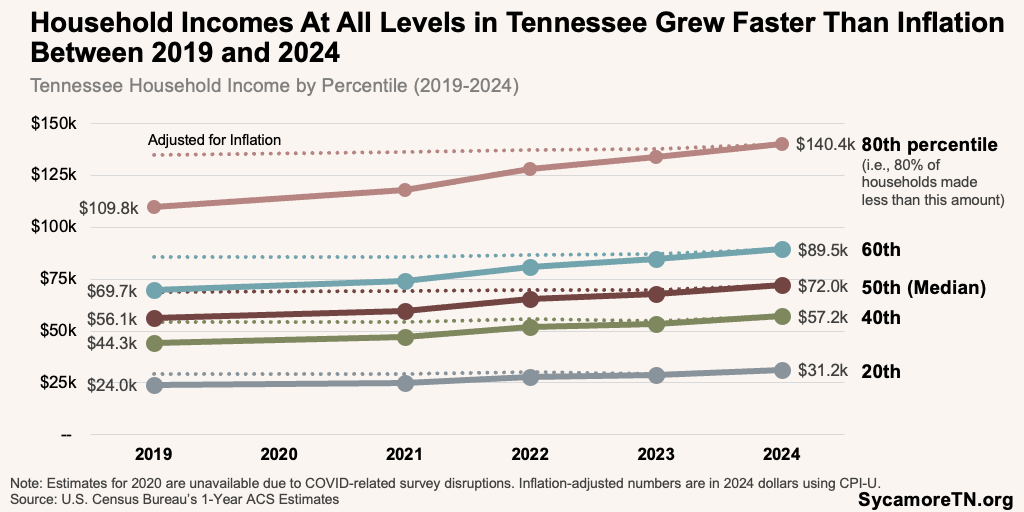
Both average annual wages and incomes at all levels in Tennessee experienced real growth (i.e. adjusted for inflation) since 2019. Average annual pay grew by 36% between 2019 and 2025—or 8% after adjusting for inflation. (11) Meanwhile, household incomes—which provides a more complete picture of the resources available to families and other household types—also grew across the spectrum but at a more modest rate (Figure 7):
- The median household income—the 50th percentile, where half of households earn more and half earn less—jumped by over 28% between 2019 and 2024. After adjusting for inflation, the increase was about 5%. Across the income distribution, that jump ranged from 30% for households at the 20th percentile to just under 28% for those at the 80th percentile—or from 6% to 4% after adjusting for inflation. (12)(9)
- Between 2019 and 2024, the 20th percentile income grew from about 21.9% of the 80th percentile income to about 22.2%. However, the dollar difference also grew from about $105,200 to about $109,200 after adjusting for inflation. (12)(9)
Figure 7
Most Tennessee counties similarly saw wage and income growth that outpaced inflation, but the trends varied significantly. All but three counties saw average annual wages grow faster than inflation (Figure 8), and income growth outpaced inflation in all but 10 (Figure 9). Between 2019 and 2025, wage growth ranged from 65% in Haywood County to 22% in McMinn. After inflation, those changes amounted to 31% growth and a 3% decline, respectively. Meanwhile, income growth from 2019 to 2024 ranged from a 53% increase in Roane County to 11% in Hardeman. With inflation, those changes amounted to 25% growth and a 10% drop, respectively. (11) (13) (9)
Figure 8
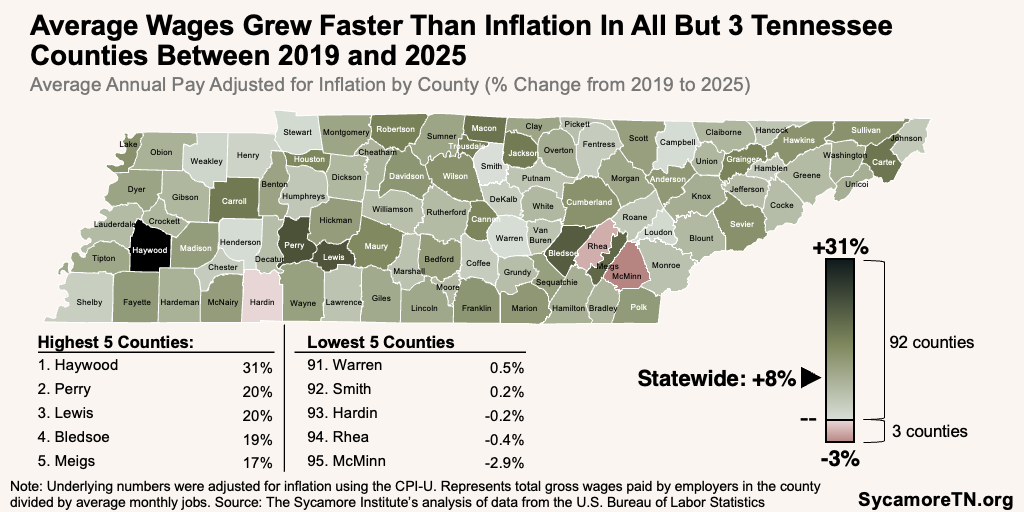
Figure 9
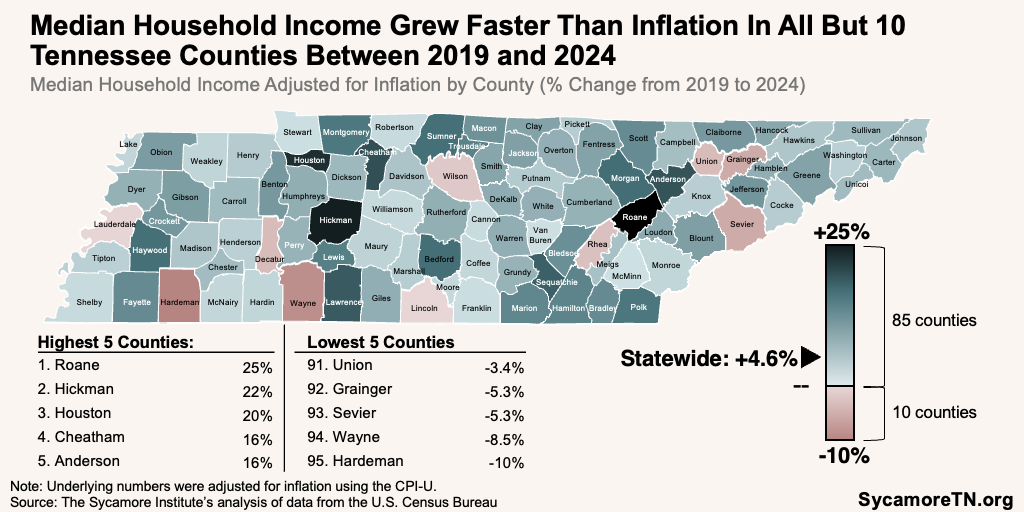
Figure 10
4. Trends in Tennesseans’ Ability to Afford Basic Needs Paint a Mixed Picture and Do Not Capture More Recent Conditions.
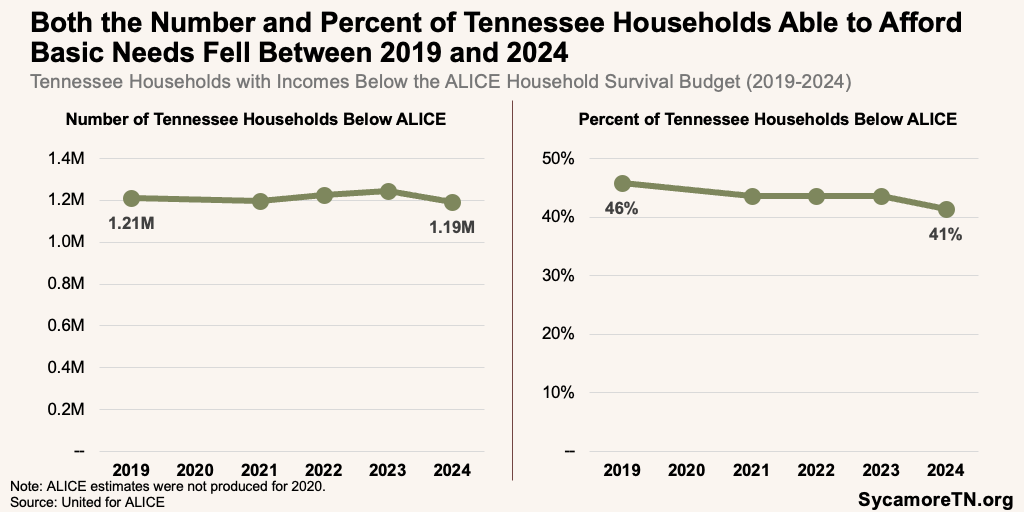
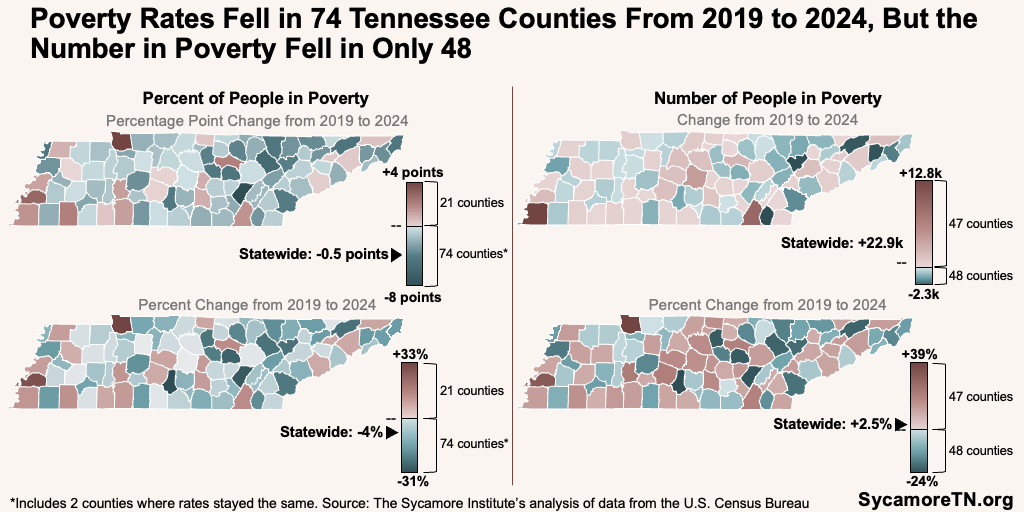
Rates of financial hardship in Tennessee generally declined between 2019 and 2024, but changes in the number of affected households and people were more mixed across counties. Statewide, estimates of both the share and number of Tennessee households that may have struggled to afford basic needs under the ALICE household survival budget declined from 2019 to 2024 (Figure 10). During that time, however, that share increased in 24 counties while the number of households increased in 54 (Figure 11). (1) Meanwhile, the statewide poverty rate fell during the same time period, but due to population growth, the number of people in poverty went up (Figure 12). Across counties, 21 had poverty rate increases while 47 saw growth in the number in poverty (Figure 13). (13)
Figure 11
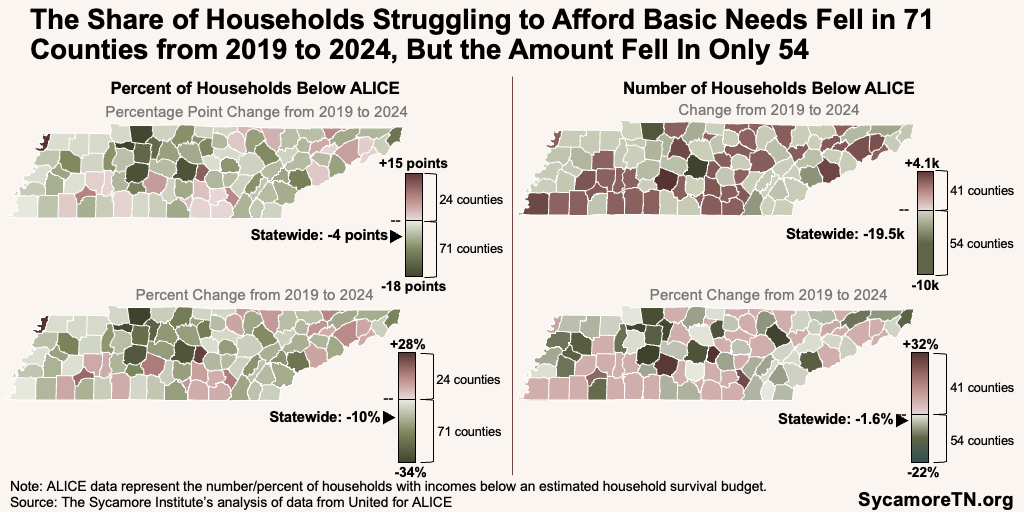
Figure 12
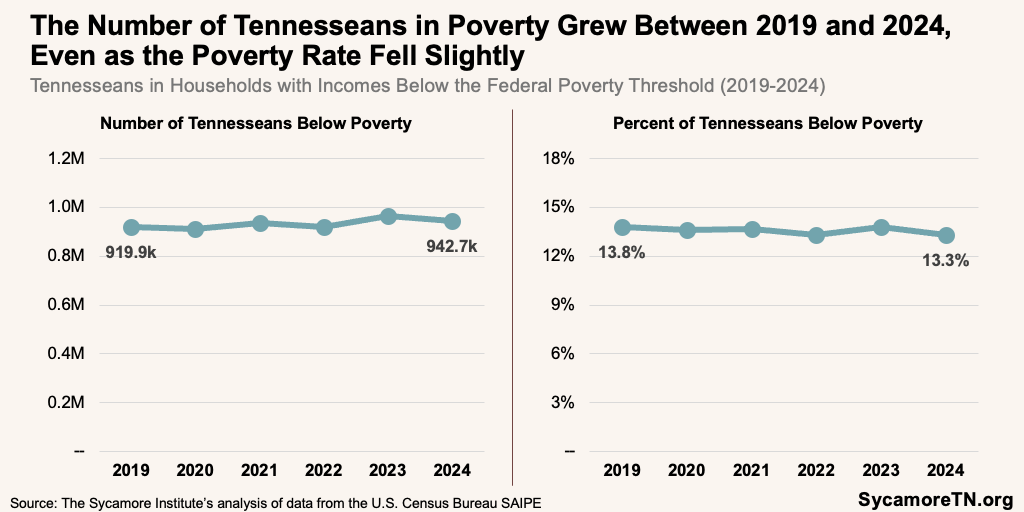
Figure 13
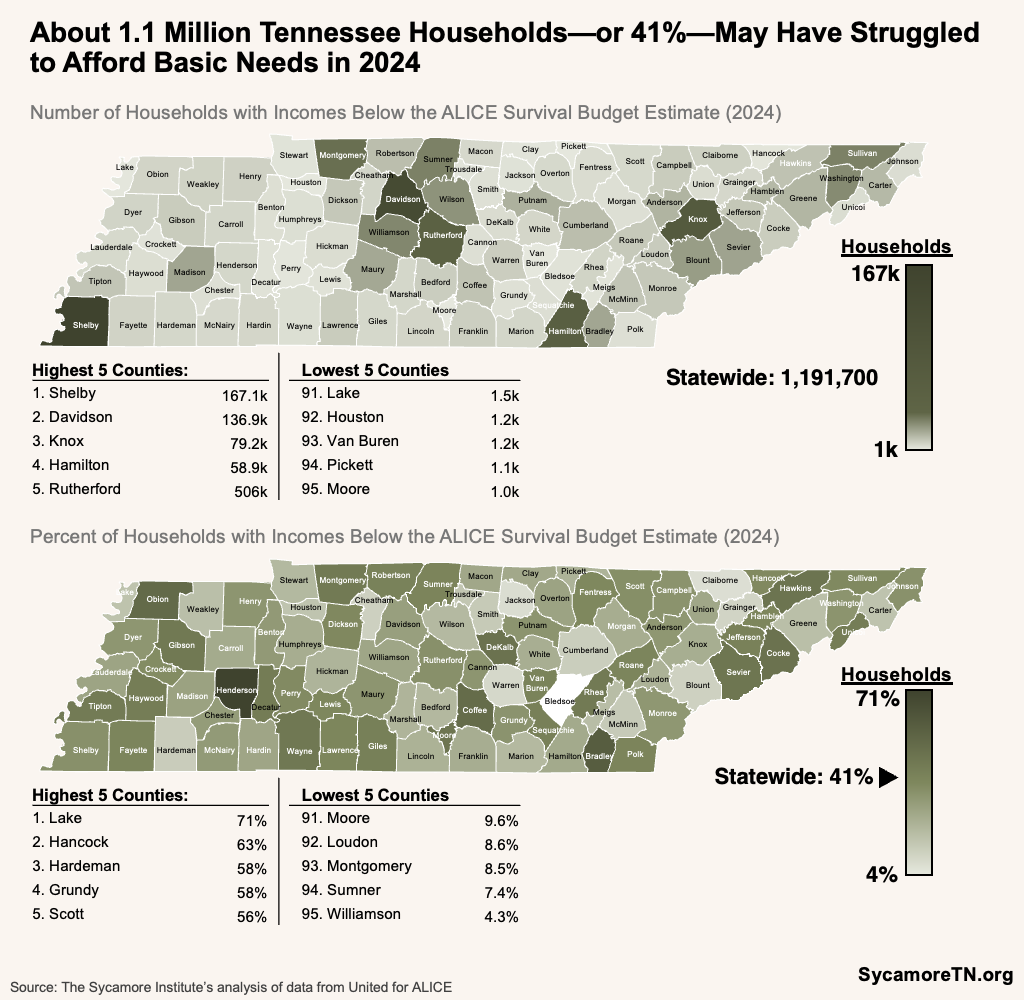
In 2024, about 1.2 million households in Tennessee (or 41%) may have struggled to afford basic needs—a decline from 2019—but the rate and trend varied by county. According to ALICE estimates, these households had incomes less than their corresponding household survival budget (Figure 1). The number of households with incomes under this threshold in 2024 was about 19,000 less (or -1.6%) than the same estimate for 2019, while that number as a share of all households declined by 4.5 percentage points (or -9.8%). County-level data show:
- Number of Households — The number of households below ALICE in 2024 ranged from fewer than 1,000 in Moore County to more than 167,000 in Shelby County (Figure 14). Compared to 2019, 54 counties saw declines in the number of households with incomes below ALICE, and 41 saw increases (Figure 11).(1)
- Percent of Households — The share of households below ALICE varied from 27% in Williamson County to 71% in Lake County (Figure 14). Compared to 2019, this share was lower in 2024 for 71 counties—including 17 where the overall number under ALICE increased even as the proportion declined (Figure 11). (1)
Figure 14
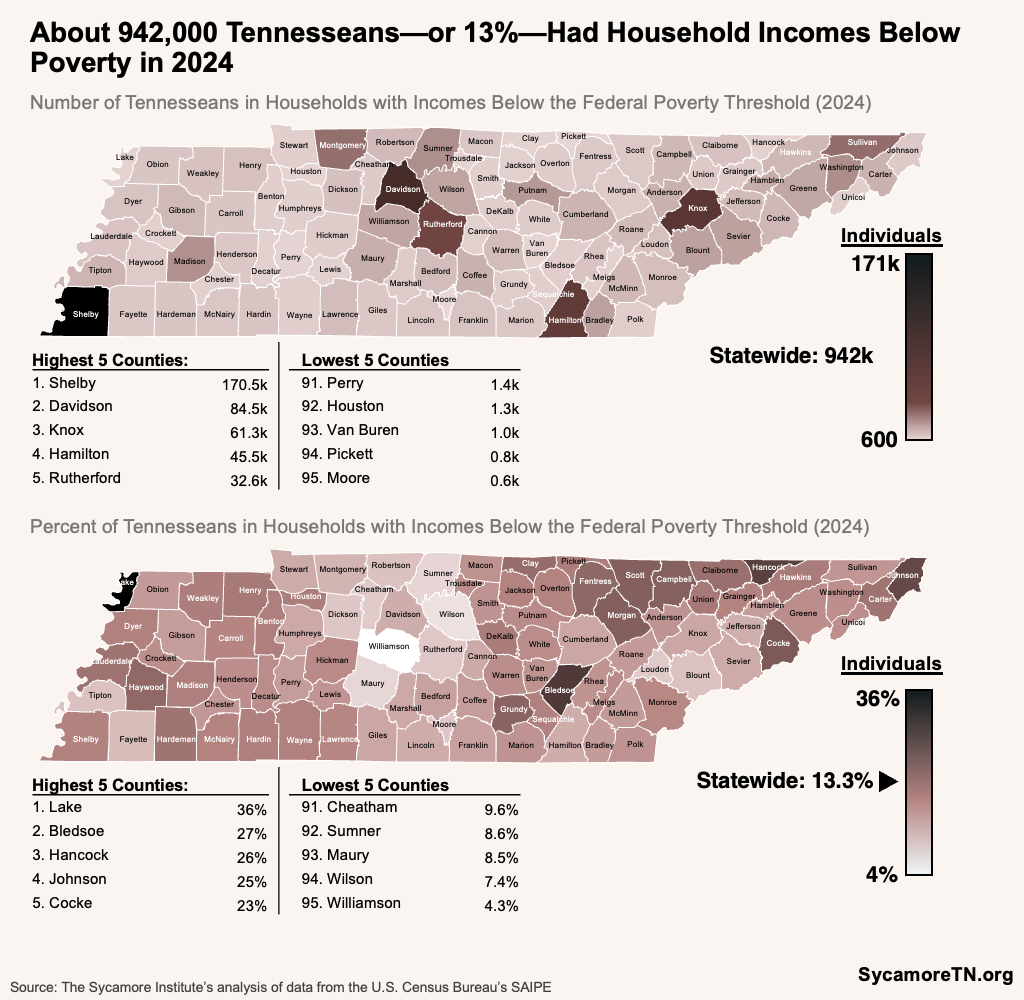
About 943,000 Tennesseans (or 13.3%) were in households with incomes under the poverty line in 2024—a higher number but a lower proportion than in 2019—but this also varied by county. The number of individuals in households with incomes under the official poverty threshold in 2024 was about 22,880 higher (or 2.5%) than the same estimate for 2019, while the poverty rate declined by 0.5 percentage points (or -3.6%) (Figure 12). County-level data show:
- Number of Tennesseans — The number of Tennesseans in poverty in 2024 ranged from fewer than 600 in Moore County to more than 170,500 in Shelby County (Figure 15). Compared to 2019, 48 counties saw declines in the number of people in poverty and 47 saw increases (Figure 13). (13)
- Percent of Tennesseans — County-level poverty rates, meaning the share of all residents in households with incomes under the poverty threshold, were between 4.3% in Williamson County and nearly 36% in Lake County (Figure 15). Compared to 2019, the 2024 poverty rate was lower or the same in 74 counties—including 26 counties where the number of people in poverty rose even as the rate fell or stayed the same (Figure 13). (13)
Figure 15
These data, however, do not capture the cost and income effects of more recent conditions that could affect financial well-being in either direction. For example, the 2025 data on Tennessee job-based health insurance premiums above show a decline from 2024 costs, but nationally, premiums reportedly increased more rapidly in 2026 than in prior years across most sectors. (14) (15) (16) Similarly, gas prices in August 2026 were about 28% higher than they were in August 2025 and 17% higher than in August 2024. (17) In contrast, housing costs have reportedly slowed significantly or even declined in the last couple of years in many parts of the state. (18) (19) Depending on income trends and household budgets, these more recent conditions could mitigate or exacerbate financial hardship.
Additional Sycamore Resources
- Socioeconomic Indicators Dashboards for Tennessee, Tennessee’s Counties, and Tennessee’s Legislative Districts (Note: These dashboards use American Community Survey estimates for income and poverty, while this brief uses Small Area Income and Poverty Estimates. Estimates are slightly different as SAIPE combines ACS data with administrative data to produce annual county-level estimates.)
- Childcare in Tennessee
- Sycamore’s Series on Housing
- Tennessee’s ACA Marketplace: How Enhanced Subsidies Shaped Coverage and Costs
- 5 Ways to Measure Prosperity in Tennessee
[1] HUD estimates the 40th percentile fair market rent for each of Tennessee’s 95 counties based on 72 geographic groupings. The underlying numbers of this calculation represent the median of all 95 counties’ estimates.
References
Click to Open/Close
References
- United for ALICE. The State of ALICE in Tennessee. [Online] 2026. https://www.unitedforalice.org/introducing-ALICE/tennessee.
- Fisher, Gordon M. The Development and History of the U.S. Poverty Thresholds — A Brief Overview. U.S. Department of Health and Human Services (HHS). [Online] 1997. https://aspe.hhs.gov/topics/poverty-economic-mobility/poverty-guidelines/further-resources-poverty-measurement-poverty-lines-their-history/history-poverty-thresholds.
- Dalaker, Joseph. The Supplemental Poverty Measure: Its Core Concepts, Development, and Use. The Congressional Research Service (CRS). [Online] July 19, 2022. https://www.congress.gov/crs-product/R45031.
- U.S. Census Bureau. Poverty Thresholds by Size of Family and Number of Children (2024). [Online] 2025. https://www.census.gov/data/tables/time-series/demo/income-poverty/historical-poverty-thresholds.html.
- Tennessee Housing Development Agency (THDA). Tennessee Home Sales Data (2019-2024). [Online] https://thda.org/research-and-reports/tennessee-home-sales-data/.
- U.S. Department of Housing and Urban Development (HUD). FMR History 1983 – Present: 2-Bedroom Unit Data. HUD Fair Market Rents (40th Percentile Rents). [Online] Accessed from https://www.huduser.gov/portal/datasets/fmr.html#history.
- Tennessee Department of Human Services. Child Care Market Rate Survey reports for 2019-2025. [Online] Available from https://digitaltennessee.tnsos.gov/hs_market_rate_surveys/.
- U.S. Bureau of Labor Statistics (BLS). Consumer Price Index for the Southeast (Dec 2019-Dec 2025). [Online] Available from https://www.bls.gov/regions/southeast/cpi-summary/2025/home.htm.
- —. Consumer Price Index for All Urban Consumers: All Items in U.S. City Average [CPIAUCSL]. [Online] Retrieved from FRED, Federal Reserve Bank of St. Louis; https://fred.stlouisfed.org/series/CPIAUCSL.
- U.S. Agency for Healthcare Research and Quality (AHRQ). Private Sector – State: Premiums/Contributions/Enrollment. Medical Expenditure Panel Survey (MEPS) Insurance Component (IC). [Online] Available from https://datatools.ahrq.gov/meps-ic/.
- U.S. Bureau of Labor Statistics (BLS). Quarterly Census of Employment and Wages (QCEW). [Online] Accessed from https://www.bls.gov/data/home.htm.
- U.S. Census Bureau. American Community Survey 1-Year Estimates for 2019-2024. [Online] Accessed from https://data.census.gov/.
- —. Small Area Income and Poverty Estimates (SAIPE) Datasets. [Online] 2020-2026. Accessed from https://www.census.gov/programs-surveys/saipe/data/datasets.html.
- Aon. U.S. Employer Health Care Costs Continue Multi-Year Climb, Projected to Rise 9.5% in 2027. [Online] August 20, 2026. https://aon.mediaroom.com/2026-08-20-Aon-U-S-Employer-Health-Care-Costs-Continue-Multi-Year-Climb,-Projected-to-Rise-9-5-in-2027.
- Business Group on Health. Business Group on Health Survey: 9% Health Care Cost Increase for 2026. [Online] August 19, 2026. https://www.businessgrouphealth.org/newsroom/news-and-press-releases/press-releases/2026-employer-health-care-strategy-survey.
- McGough, Matt, et al. How Much and Why Premiums are Going Up for Small Businesses in 2026. Peterson-KFF Health System Tracker. [Online] September 24, 2025. https://www.healthsystemtracker.org/brief/how-much-and-why-premiums-are-going-up-for-small-businesses-in-2026/.
- U.S. Energy Information Administration. Gasolean and Diesal Fuel Prices Data (All Grades Conventional). [Online] August 18, 2026. Accessed from https://www.eia.gov/petroleum/gasdiesel/.
- Zillow. Tennessee Housing Market Home Values Index. [Online] https://www.zillow.com/home-values/53/tn/.
- Realtor.com. 2026 Tennessee Housing Market Trends & Insights. [Online] https://www.realtor.com/local/market/tennessee.