
Key Takeaways
- Housing is a key driver of individual and family well-being, and an important component of thriving communities.
- Rising demand—especially from population growth and in-migration—has reshaped Tennessee’s housing market.
- Over the past decade, Tennessee’s housing supply did not keep up with demand.
- Housing affordability challenges are widespread—particularly affecting suburban and rural communities in Tennessee—though conditions have eased slightly in some areas of the state.
- Federal, state, and local policy decisions shape housing supply, cost, and access. Recent policy changes aim to improve housing supply and streamline development, but their effects remain to be seen.
- Expanding housing access involves trade-offs between cost, community preferences, and infrastructure.
The decisions made by Tennessee’s next governor and General Assembly will shape the state’s future for years to come. Throughout the remainder of 2026, the Sycamore Institute will release a series of concise, evidence-based insights drawn from our past research to provide context on the policies, trends, and challenges that could define Tennessee’s next chapter. Each brief offers an accessible overview of an important issue and, in some cases, links to deeper analysis for those who want to explore it further.
This brief focuses on housing in Tennessee—providing an overview of the state’s housing landscape and key insights from Sycamore’s prior research in this area.
1. Housing is a key driver of individual and family well-being, and an important component of thriving communities.
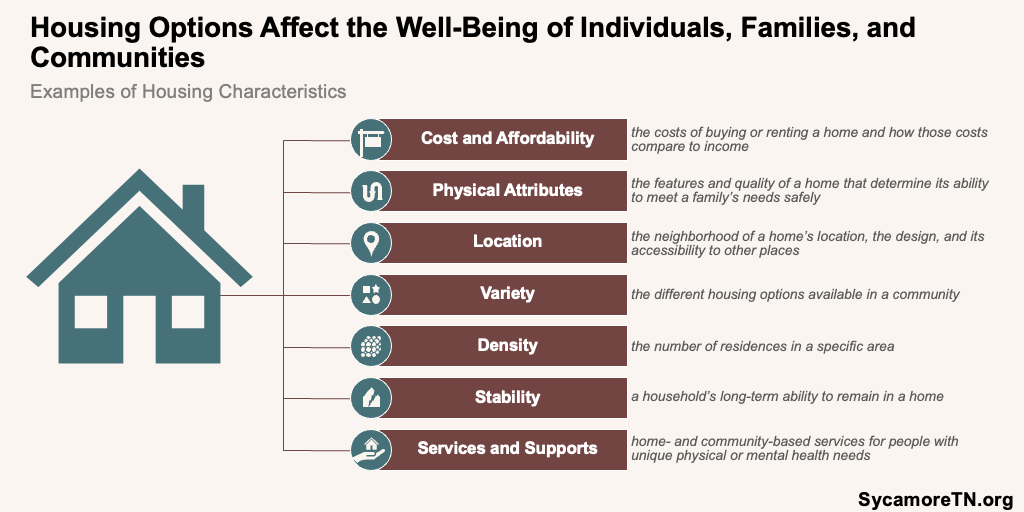
Housing plays a central role in the well-being of Tennesseans and the strength of communities. As a basic necessity, a home provides shelter and stability, while its cost, quality, and location shape financial security, health, education, transportation, and access to jobs and services (Figure 1). These connections make housing a key driver of opportunity and outcomes for individuals, families, and communities across Tennessee.
Figure 1
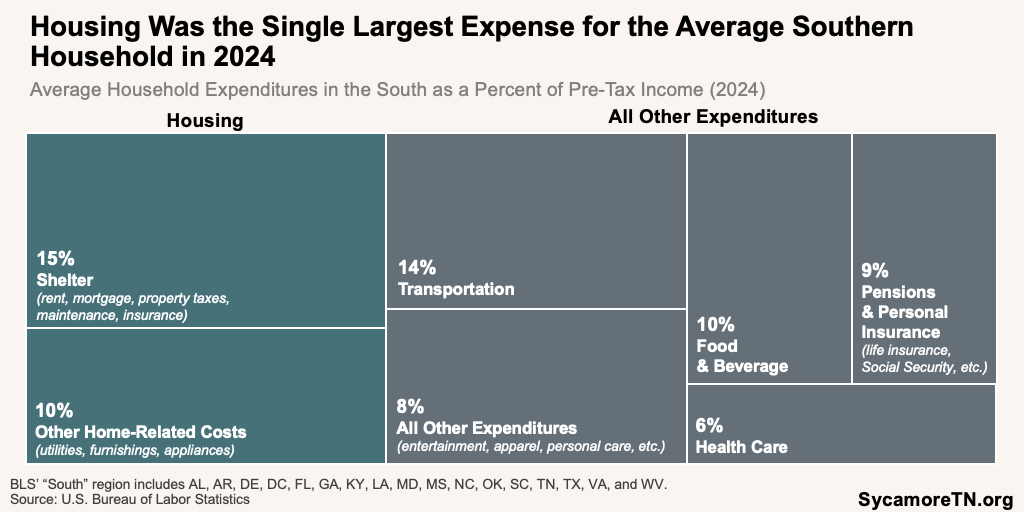
Housing is often a household’s largest expense, making it an important factor in financial security (Figure 2). In 2024, housing costs—including rent, mortgage payments, property taxes, insurance, and utilities—accounted for about one-quarter of average household spending in the South, as a share of pretax income. (1) Higher housing costs often leave households with less to spend on other necessities, such as food, transportation, and health care, or to save for the future.
Figure 2
See related discussion in Why Housing Matters for Tennessee.
2. Rising demand—especially from population growth and in-migration—reshaped Tennessee’s housing market.
Tennessee’s housing market has changed significantly in recent years, largely due population growth and rising demand. Population growth—driven in part by an influx of new residents from other states—has increased competition for housing across much of the state, particularly since 2020. Many of these new residents moved from higher-cost, higher-income areas, bringing additional purchasing power that intensified demand pressures in local housing markets (Figure 3). (2) (3)
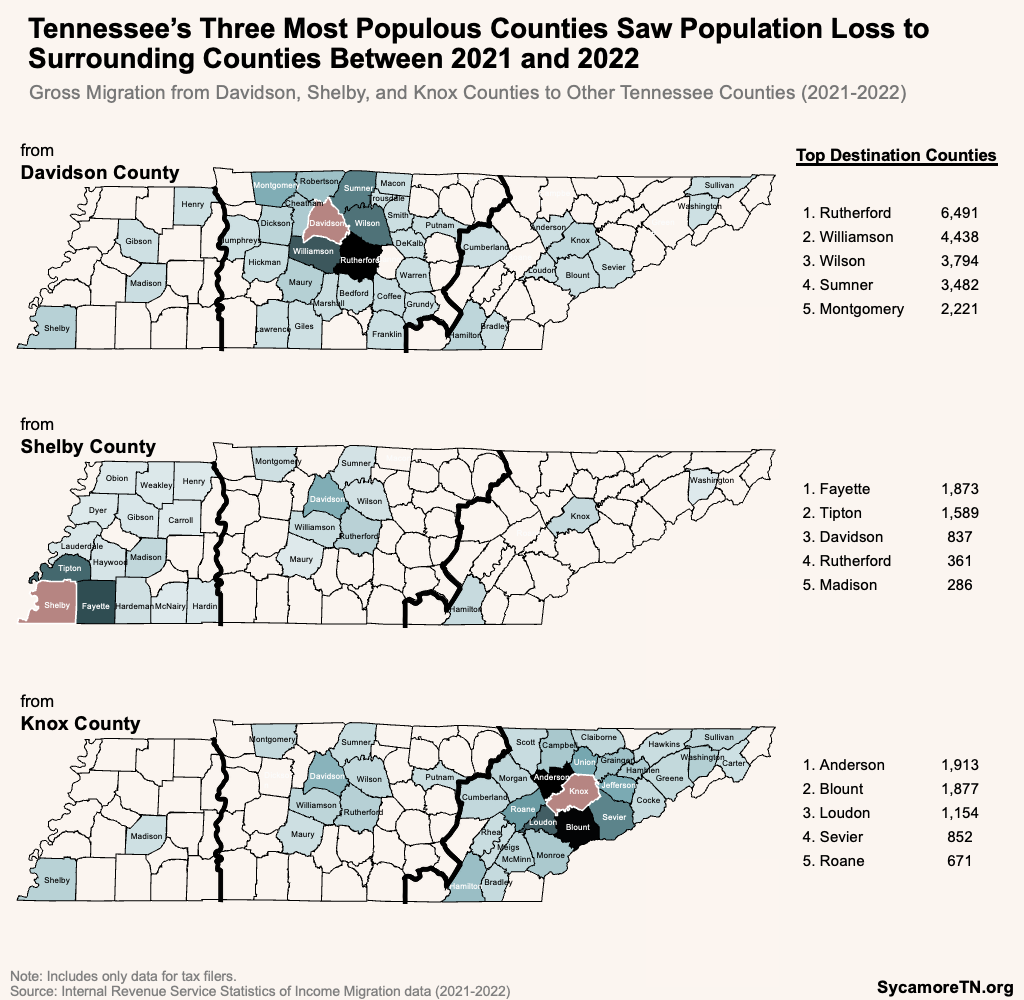
At the same time, migration patterns within Tennessee shifted demand across regions. Some households moved from urban centers into suburban and rural communities, spreading housing pressures beyond traditionally high-cost areas (Figure 4). (4) Together, these trends reshaped where demand is strongest and contributed to rising housing costs across a broader set of communities.
Figure 3
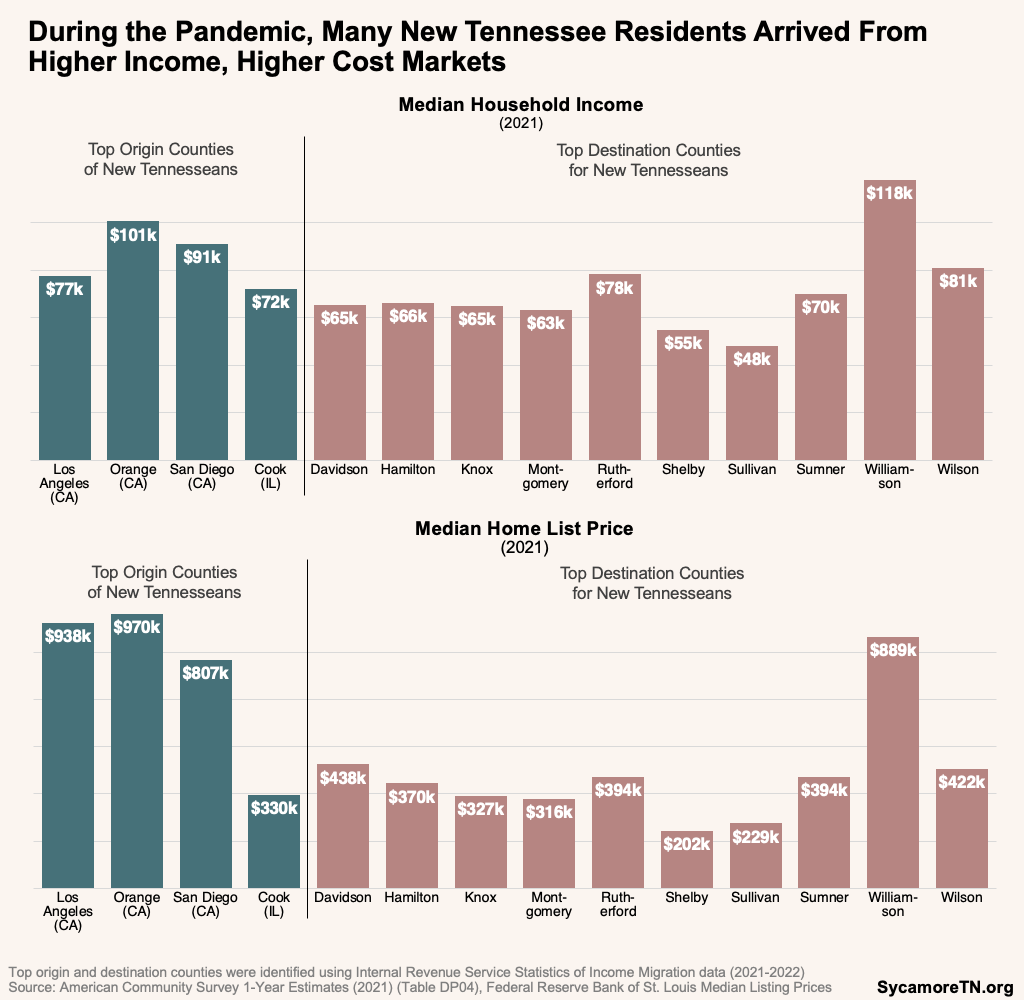
Figure 4
3. Over the past decade, Tennessee’s housing supply did not keep up with demand.
Tennessee’s housing market reflects an imbalance between supply and demand. Homebuilding slowed significantly during the Great Recession and, despite a recovery in the 2010s, never fully caught up with population growth and rising demand. When additional pressures emerged during the pandemic—including in-migration—this gap widened further, contributing to tight housing supply and rising prices. (5)
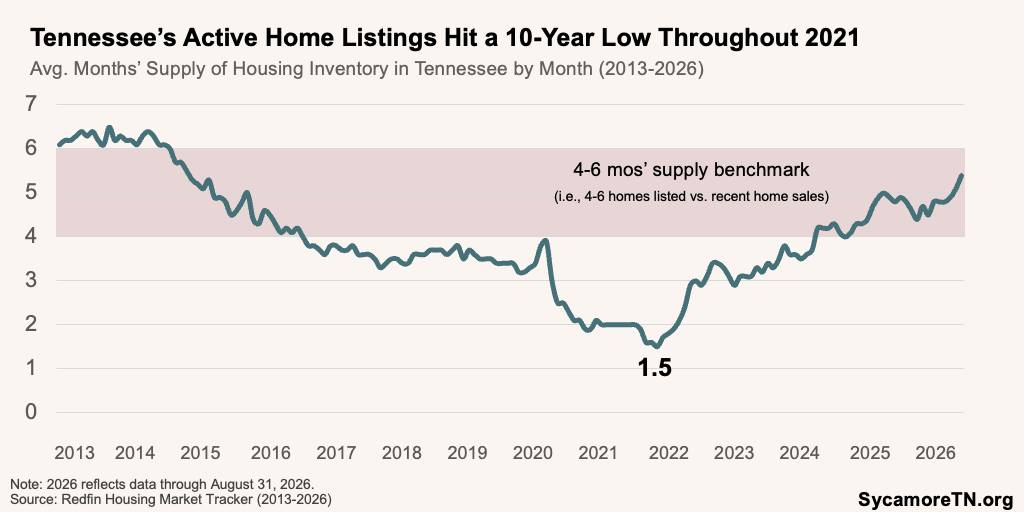
Housing availability measures highlight the constraints on supply. “Months’ supply” compares the number of houses listed for sale with the number of recent home sales. As this number becomes smaller, it indicates more demand, less supply, or both—which tends to result in higher prices. Generally, four to six months’ supply is the optimal spot for housing markets to appreciate at a consistent rate. (6) (7) During the pandemic, the number of homes available for sale relative to the number of recent sales fell to historically low levels at 1.5 months’ supply in January 2022. However, this has improved in recent years—indicating that housing supply is catching up with the pace of sales (Figure 5). (8)
Figure 5
See related discussion in Tennessee’s Housing Challenges: Where and Why It Got So Expensive.
4. Housing affordability challenges are widespread—particularly affecting suburban and rural communities in Tennessee.
Housing costs in Tennessee rose faster than incomes in many areas during the 2020s, reducing affordability for a growing number of households. As demand outpaced supply, both home prices and rents increased, making it more difficult for renters and prospective homebuyers—especially those with lower or moderate incomes—to find options within their budgets.
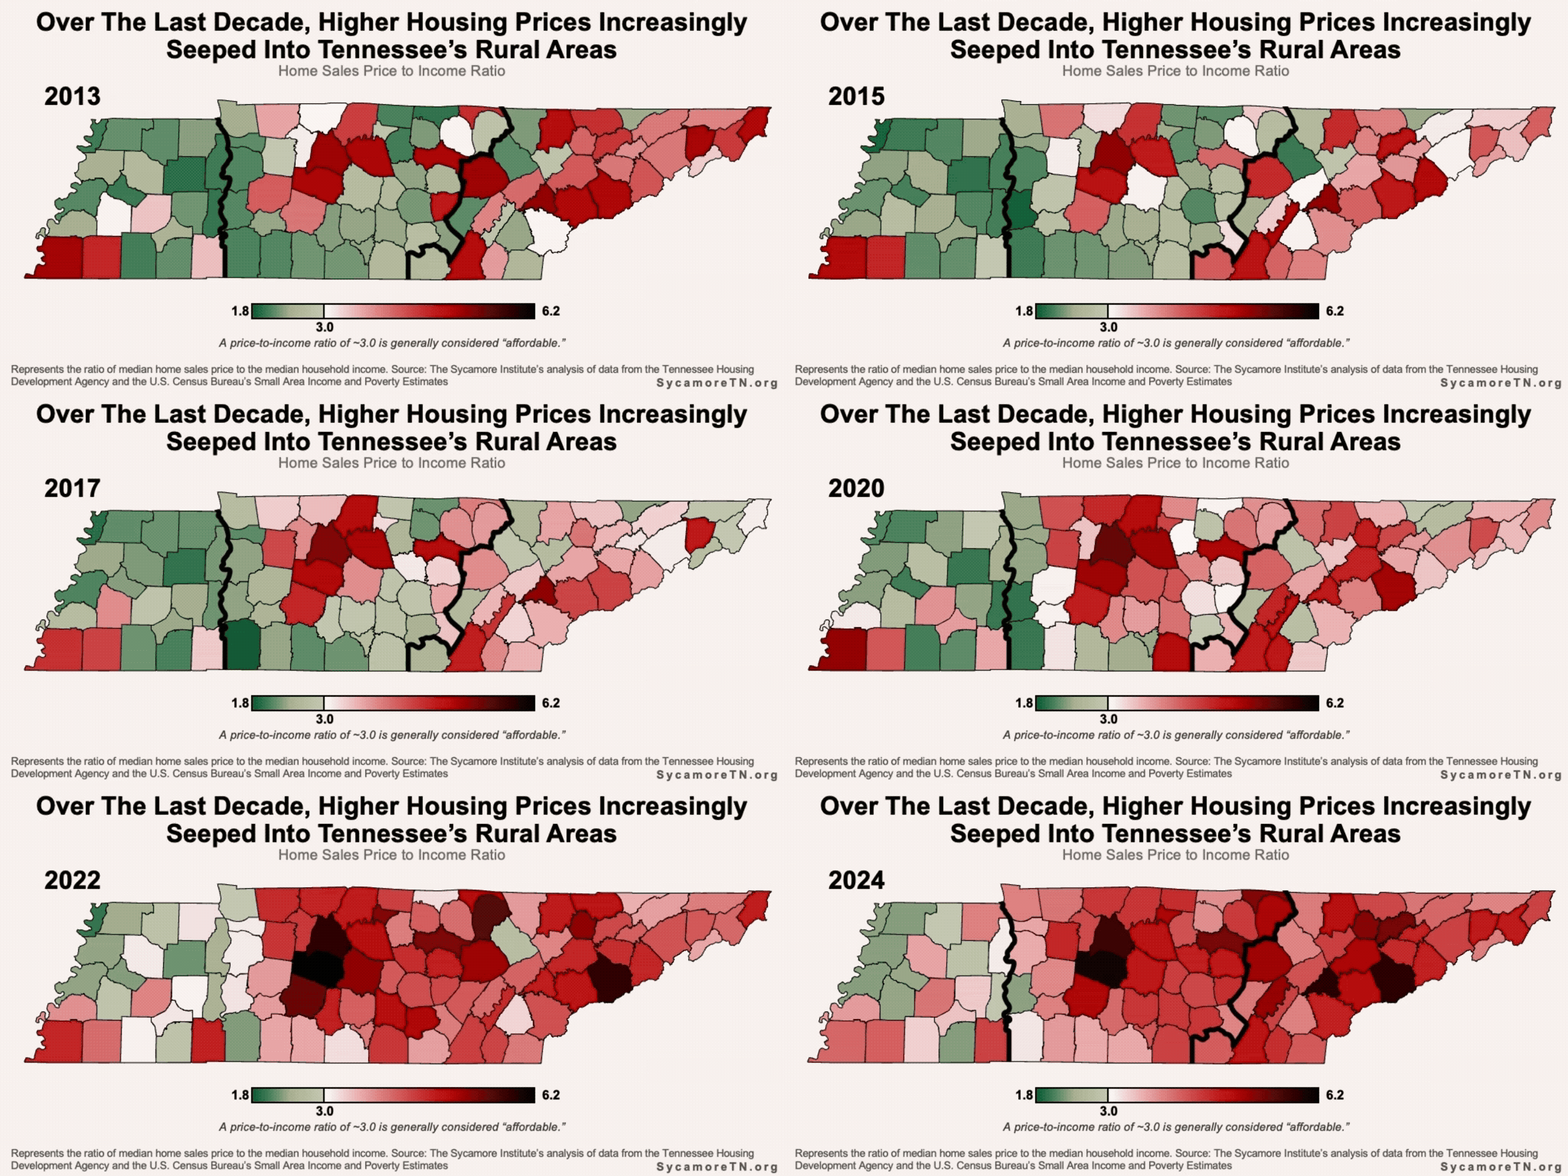
In the immediate years prior to and after the pandemic, these challenges spread to suburban and rural communities that haven’t typically faced them (Figure 6). (9) (10) In some cases, smaller and rural areas saw faster growth in the gap between income and housing costs, suggesting that affordability pressures have become more widespread across Tennessee.
Figure 6
Available evidence suggests that housing costs may be moderating in some parts of Tennessee, although trends vary across markets. Some metropolitan areas, including Memphis and Kingsport-Bristol, experienced slight declines in median home prices in early 2026. (11) However, the statewide median home sales price reached a record high of $360,000 in 2025, with prices increasing in most counties. (12) These trends suggest that some local markets may be easing, but housing affordability remains a challenge across much of Tennessee.
See related discussion in Tennessee’s Housing Challenges: Where and Why It Got So Expensive.
5. Federal, state, and local policy decisions shape housing supply, cost, and access.
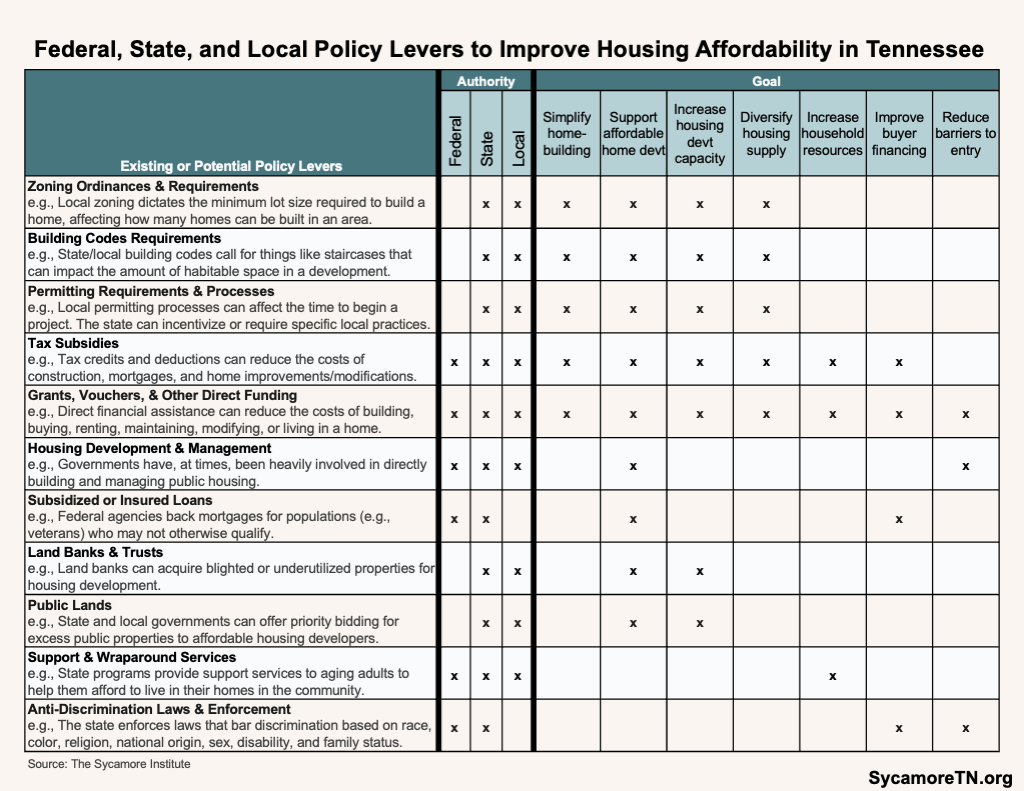
Federal, state, and local policymakers can influence housing access, affordability, and supply through a range of policy levers (Table 1). These include housing subsidies and financing programs, as well as policies that govern land use, development, and construction. Together, these policies affect the resources available to households and the cost, type, location, and pace of housing development.
Some policy levers directly affect how and where housing can be developed. For example, zoning designations, minimum lot sizes, density requirements, building codes, and permitting processes can influence the feasibility, cost, and timing of new housing. Policies that limit density or require larger lots can constrain the number of homes that can be built, while streamlined approvals or greater flexibility can make development easier. Infrastructure requirements—such as extending roads, water, and sewer service—can also increase development costs, particularly in areas where existing systems lack capacity or new infrastructure is needed.
These policies also serve other community goals and can involve trade-offs. Zoning and development regulations, for example, can help communities manage growth, ensure safety, and preserve neighborhood character. Policymakers must therefore balance these priorities with the need for housing that is available and affordable to Tennessee households.
Recent policy changes illustrate how these levers continue to evolve. At the federal level, the 21st Century ROAD to Housing Act—signed into law in July 2026—includes measures intended to expand housing supply and modify federal housing programs. (13) In Tennessee, recent legislation has sought to streamline development approvals and permitting to reduce delays in housing development. For example, the state passed a law in 2026 to establish deadlines for local governments to review development applications, conduct inspections, and release financial guarantees for development projects. The state also expanded the authority of industrial development boards to support eligible affordable housing and public infrastructure projects. (14) (15) (16) (17) These policy changes reflect different approaches to addressing housing supply and affordability, but their effects will depend on implementation at the federal and state level.
See related discussion in Access to Housing in Tennessee: The Federal, State, and Local Policy Levers, Making Homes Make Cents: How Affordable Housing is Financed, and Lines of a Map, Rules on the Ground.
6. Expanding housing access involves trade-offs between cost, community preferences, and infrastructure.
Efforts to expand housing access often require balancing competing priorities. Policies that increase housing supply—such as allowing higher-density development or streamlining approvals—can help reduce costs and improve availability. However, these approaches may also place additional demands on infrastructure, alter neighborhood characteristics, or generate community opposition.
Programs to improve housing affordability can also require additional resources. Programs such as subsidies or incentives for below-market housing can improve access for lower-income households but may require funding or changes to existing policies. As a result, housing decisions often involve trade-offs that reflect local values, resources, and priorities, requiring policymakers to weigh multiple outcomes when designing solutions.
Table 1
Additional Sycamore Resources
- Why Housing Matters for Tennessee
- Tennessee’s Housing Challenges: Where and Why It Got So Expensive
- Access to Housing in Tennessee: The Federal, State, and Local Policy Levers
- Making Homes Make Cents: How Affordable Housing is Financed
- Lines of a Map, Rules on the Ground
- Event Summary: Housing Policy Summit
- Webinar Recording: Understanding Rural Housing in Tennessee
References
Click to Open/Close
References
- U.S. Bureau of Labor Statistics (BLS). Table 1800. Region of Residence: Annual Expenditure Means, Shares, Standard Errors, and Relative Standard Errors. 2024 Consumer Expenditure Surveys. [Online] 2024. [Cited: October 6, 2026.] https://www.bls.gov/cex/tables.htm
- U.S. Census Bureau. Selected Housing Characteristics. American Community Survey, 1-Year Estimates (Table DP04). [Online] 2024. https://data.census.gov/table/ACSDP1Y2023.DP04?q=DP04&g=010XX00US_040XX00US47
- Federal Reserve Bank of St. Louis. Housing Inventory: Median Listing Price. (MEDLISPRI {47189, 47187, 47165, 47163, 47157, 47149, 47125, 47093, 47065, 47037, 6073, 6059, 17031, 6037}). [Online] [Cited: January 7, 2025.] https://fred.stlouisfed.org/series/MEDLISPRI6037
- Internal Revenue Service. SOI Tax Stats – Migration Data (2021-2022). [Online] July 29, 2024. https://www.irs.gov/statistics/soi-tax-stats-migration-data
- Federal Reserve Bank of St. Louis. The Great Recession and Its Aftermath. Federal Reserve History. [Online] November 22, 2013. https://www.federalreservehistory.org/essays/great-recession-and-its-aftermath
- Redfin. Data Center Metrics Definitions. Redfin. [Online] [Cited: October 15, 2026.] https://www.redfin.com/news/data-center-metrics-definitions/
- Weinstock, Lida. U.S. Housing Supply: Recent Trends and Policy Considerations. Library of Congress. [Online] July 7, 2023. [Cited: October 15, 2026.] https://www.congress.gov/crs-product/R47617#fn12
- Redfin. Redfin Data Center Download Hub. Housing Market Tracker. [Online] 2013-2026. [Cited: October 6, 2026.] https://www.redfin.com/news/data-center/downloads/#card-housing_market
- Tennessee Housing Development Agency. Home Sales: New and Existing Homes. Tennessee Housing Development Agency. [Online] January 2025. https://thda.org/research-reports/tennessee-housing-market/tennessee-home-sales-data
- U.S. Census Bureau. Small Area Income and Poverty Estimates (SAIPE). [Online] 2013-2024. https://www.census.gov/data-tools/demo/saipe/#/?s_state=47&s_county=47001,47003,47005,47007,47009,47011,47013,47015,47017,47019,47021,47023,47025,47027,47029,47031,47033,47035,47037,47039,47041,47043,47045,47047,47049,47051,47053,47055,47057,47059,47061,4
- Hart, Jimmy. MTSU report: Tennessee housing market shows stability in first quarter as home prices rise. Middle Tennessee State University. [Online] July 2, 2026. [Cited: October 12, 2026.] https://mtsunews.com/2026/07/02/housing-tennessee-report-q1-2026/
- Tennessee Housing Development Agency. Tennessee Home Sales Data. [Online] 2025. [Cited: October 12, 2026.] https://thda.org/research-and-reports/tennessee-home-sales-data/
- U.S. Congress. H.R.6644 – 21st Century ROAD to Housing Act. Congress.gov. [Online] July 11, 2026. [Cited: October 12, 2026.] https://www.congress.gov/bill/119th-congress/house-bill/6644
- State of Tennessee. Public Chapter No. 771. Tennessee Secretary of State. [Online] April 23, 2024. [Cited: October 12, 2026.] https://publications.tnsosfiles.com/acts/113/pub/pc0771.pdf
- —. Public Chapter No. 1044. Tennessee Secretary of State. [Online] May 22, 2026. [Cited: October 12, 2026.] https://publications.tnsosfiles.com/acts/114/pub/pc1044.pdf
- —. Public Chapter No. 353. Tennessee Secretary of State. [Online] May 2, 2025. [Cited: October 15, 2026.] https://publications.tnsosfiles.com/acts/114/pub/pc0353.pdf
- —. Public Chapter No. 987. Tennessee Secretary of State. [Online] May 19, 2026. [Cited: October 15, 2026.] https://publications.tnsosfiles.com/acts/114/pub/pc0987.pdf
- U.S. Census Bureau. Selected Housing Characteristics, American Community Survey 1-Year Estimates (Table DP04). [Online] 2024. https://data.census.gov/table/ACSDP1Y2023.DP04?q=DP04&g=010XX00US_040XX00US47
19. Federal Reserve Bank of St. Louis. Housing Inventory: Median Listing Price (MEDLISPRI {47189, 47187, 47165, 47163, 47157, 47149, 47125, 47093, 47065, 47037, 6073, 6059, 17031, 6037}). [Online] January 7, 2025. https://fred.stlouisfed.org/series/MEDLISPRI6037